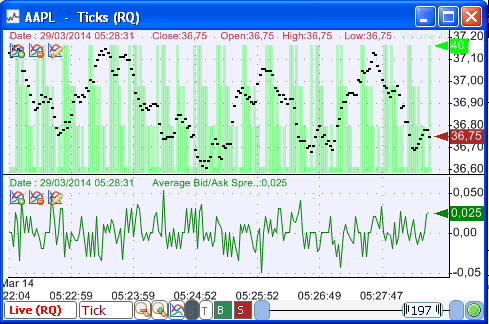
A new function introduced in version 3.0.1 of QuantShare allows you to create custom functions/indicators based on bid/ask data.
This function cannot be accessed directly from the QuantShare programming language but we can use it in the custom functions tool to create new functions (C# based) that can be referenced later by the QuantShare programming language.
Calculate the Average Bid/Ask Spread
The indicator we are going to implement now, calculates the average ask price for a specific bar then subtracts it to the average bid price for that same bar. If you are displaying a one-minute chart then the average ask/bid is calculated based on all ask/bid updates that occurred during that bar.
- Select "Tools -> Create Function"
- Click on "Add" then type "AvgBidAskSpread"
In the formula editor, type the following code:
// Get the bid vector (history) for the current symbol
VectorCustomDouble bid = cFunctions.GetBidAskData(cFunctions.Symbol, "bid");
// Get the bid vector (history) for the current symbol
VectorCustomDouble ask = cFunctions.GetBidAskData(cFunctions.Symbol, "ask");
// Check if we have bid/ask data the current symbol
if(bid.Length > 0 && ask.Length > 0)
{
// Loop through each bar (we can also replace result.Length by ask.Length or bid.Length)
for(int i=0;i<result.Length;i++)
{
// Initialize the average ask variable
double avgAsk = 0;
if(ask[i].Length > 0)
{
// Loop thought each ask update that occurred within the bar i
for(int j=0;j<ask[i].Length;j++)
{
// Add the current ask to the average ask variable
avgAsk += ask[i][j];
}
// Calculate the average by dividing the sum by the number of ask updates
avgAsk = avgAsk / ask[i].Length;
}
else
{
// Set average ask to zero since there were no ask updates for bar i
avgAsk = 0;
}
// Perform the same logic for bid
double avgBid = 0;
if(bid[i].Length > 0)
{
for(int j=0;j<bid[i].Length;j++)
{
avgBid += bid[i][j];
}
avgBid = avgBid / bid[i].Length;
}
else
{
avgBid = 0;
}
// Calculate spread and add it to result vector (this vector is returned by the function)
result[i] = avgAsk- avgBid;
}
}
NB:
- The description of each instruction is included in the code.
- Bid/Ask updates are loaded from memory. QuantShare currently stores in memory the last 1000 tick/bid/ask updates. This means that only the bid/ask updates that occurred during that period will be included in the calculation.
- This indicator is available in the sharing server: 1432
Plot the Bid/Ask Spread on a Chart
Let us plot the Bid/Ask spread on a chart now.
- Open a new chart
- Right click on it then select "Create New Pane"
- Right click on the new pane then select "Edit Formula"
Since the name of the custom function we created previously is "AvgBidAskSpread", we can reference it in QS programming language just by typing it. Example:
a = AvgBidAskSpread();
plot(a, "", colorGreen);
![How to Calculate and Display the Bid/Ask Spread on a Chart]()
![]()
This function cannot be accessed directly from the QuantShare programming language but we can use it in the custom functions tool to create new functions (C# based) that can be referenced later by the QuantShare programming language.
Calculate the Average Bid/Ask Spread
The indicator we are going to implement now, calculates the average ask price for a specific bar then subtracts it to the average bid price for that same bar. If you are displaying a one-minute chart then the average ask/bid is calculated based on all ask/bid updates that occurred during that bar.
- Select "Tools -> Create Function"
- Click on "Add" then type "AvgBidAskSpread"
In the formula editor, type the following code:
// Get the bid vector (history) for the current symbol
VectorCustomDouble bid = cFunctions.GetBidAskData(cFunctions.Symbol, "bid");
// Get the bid vector (history) for the current symbol
VectorCustomDouble ask = cFunctions.GetBidAskData(cFunctions.Symbol, "ask");
// Check if we have bid/ask data the current symbol
if(bid.Length > 0 && ask.Length > 0)
{
// Loop through each bar (we can also replace result.Length by ask.Length or bid.Length)
for(int i=0;i<result.Length;i++)
{
// Initialize the average ask variable
double avgAsk = 0;
if(ask[i].Length > 0)
{
// Loop thought each ask update that occurred within the bar i
for(int j=0;j<ask[i].Length;j++)
{
// Add the current ask to the average ask variable
avgAsk += ask[i][j];
}
// Calculate the average by dividing the sum by the number of ask updates
avgAsk = avgAsk / ask[i].Length;
}
else
{
// Set average ask to zero since there were no ask updates for bar i
avgAsk = 0;
}
// Perform the same logic for bid
double avgBid = 0;
if(bid[i].Length > 0)
{
for(int j=0;j<bid[i].Length;j++)
{
avgBid += bid[i][j];
}
avgBid = avgBid / bid[i].Length;
}
else
{
avgBid = 0;
}
// Calculate spread and add it to result vector (this vector is returned by the function)
result[i] = avgAsk- avgBid;
}
}
NB:
- The description of each instruction is included in the code.
- Bid/Ask updates are loaded from memory. QuantShare currently stores in memory the last 1000 tick/bid/ask updates. This means that only the bid/ask updates that occurred during that period will be included in the calculation.
- This indicator is available in the sharing server: 1432
Plot the Bid/Ask Spread on a Chart
Let us plot the Bid/Ask spread on a chart now.
- Open a new chart
- Right click on it then select "Create New Pane"
- Right click on the new pane then select "Edit Formula"
Since the name of the custom function we created previously is "AvgBidAskSpread", we can reference it in QS programming language just by typing it. Example:
a = AvgBidAskSpread();
plot(a, "", colorGreen);
