Quantcast
Channel: QuantShare
Viewing all 106 articles
Browse latest View live

How to Backtest Your Trading System for Each Industry

$
0
0
Some trading systems, particularly fundamental-based ones, may perform very well on stocks that belong to some particular industries and perform badly on other industries.
Just like backtesting a trading system for each asset individually, you can use QuantShare to implement a system then perform a backtest for each industry. The system will be optimized and each optimization shows the result of a backtest on stocks belonging to one particular industry.


Industry Data

Is your QuantShare database populated with industry data?

To make sure it is, select "Symbol -> Auto Manage Symbols", check one or several exchanges you are interested in, check "Force the update of symbol information" then click on "Save".
After few seconds, QuantShare will update your symbols list and add if necessary industry information (Industry of each stock in your database)


Trading System

The following is the description of the trading system that is used as an example in this article.

Buy when price crosses above 25-bar simple moving average
Sell when price crosses below 25-bar simple moving average

How to implement this trading system:
- Select "Analysis -> Simulator"
- Click on "New" to create a new trading system
- Select "Create trading system using the formula editor" tab
- Type the following formula:

buy = cross(close, sma(25));
sell = cross(sma(25), close);


"Close" gets the stock's price series
"SMA" calculates the simple moving average
"Cross" function detects when the first array crosses above the second array

- Click on "Create Trading System" to save your strategy


Count the Number of Industries

First, let us count the number of industries we have in the database.
Select "Symbol -> Categories", click on "Industry" tab to display all industries. There are probably several hundred of industries there so we have to use the script editor to count these.
Open the script editor (Tools -> Script Editor), create a new script then type the following formula:

MessageBox.Show("Industry Count: " + Symbols.GetIndustryList().Length.ToString());

Click on "Execute" the display the number of industries.


Backtest Each Industry

Select the previously created trading system then click on "Update".
We have to use a custom function (IndustryPosition) to get the index position based on its name. The function can be downloaded here: 1253.

In the formula editor, type the following lines:

Optimize("a", 0, 256, 1);
b = IndustryPosition(industry());
rule1 = a == b;
buy = cross(close, sma(25)) and rule1;
sell = cross(sma(25), close);


The first line instructs QuantShare to optimize the trading system by varying the variable "a" from 0 to the total number of industries (We used 256 here).
The second line gets the industry position within industry list.
The third line compares the optimizable variable and the industry position. This means that the trading system will buy only stocks that belong to the industry that are in the position defined by the variable "a".


After updating your trading system, click on "Optimize" to start the optimization process.


Adding Industry Name to the Report

As you can see from the earlier backtesting, the report shows only the industry position within the list. It does not show the industry name directly in the report table.
There is no way to see for which industry a simulation was based unless you open the report then select "S.I.M.I -> Avg. Trade Performance" tab.

In order to add the industry name to the report, we have to use the money management script.

- Select the trading system then click on "Update"
- Select "Money Management" tab
- Click on "Add a new money management script"
- Select "OnStartSimulation" event then type the following line:

Functions.AddReportMetric("Industry", "");

- Select "OnEndSimulation" event then type the following lines:

MMPosition[] pos = Portfolio.GetAllPositions();
if(pos.Length > 0)
{
Symbol sym = Data.GetSymbolInfo(pos[0].Symbol);
Variables.SetVariable("Industry", sym.Industry);
}


Run the optimization again to display the industry name in a separate column in the backtesting report.



Using Average True Range to Measure Intraday Volatility

$
0
0
Volatility is a measure that allows you to estimate the "risk" of an asset.

There are different types of volatility:
Implied volatility: This is the estimated volatility of an asset's price.
Historical volatility: This is the realized volatility of an asset over a specific time period. It is also called the statistical volatility.

For intraday traders and those looking for an easier way to measure volatility, you can use the true range to measure intraday volatility.


True Range

The True range indicator was developed by J. Welles Wilder Jr. in the 1970's. It is a better measure of the intraday volatility than the "Range" (which the difference between the session/period high and low) because the latter understates the volatility since it only measures volatility that occurs during a bar/session and ignores overnight volatility.
To fix this, the True Range uses the bar's high, low and previous bar's close. By combining these variables, the true range considers both the intraday and overnight part of the price's volatility.

The true range is calculated by taking the greatest of the following variables:
- High (current bar) less low
- High (current bar) less previous bar's close
- Previous bar's close less low (current bar)


Implementing the Average True Range Indicator

First, let us implement the different variables described in the previous paragraph then find which one is the greatest (true range).

a = high - low;
b = high - close[1];
c = close[1] - low;

tr = max(a, max(b, c));


To calculate the average true range (ATR), we simply apply a moving average to the true range.

d = sma(tr, 10);

This will return the 10-bar average true range.

Note that QuantShare already has a built-in function ("Atr") that calculates the average true range.

Example:
d = Atr(10);


How Day Traders Measure Intraday Volatility

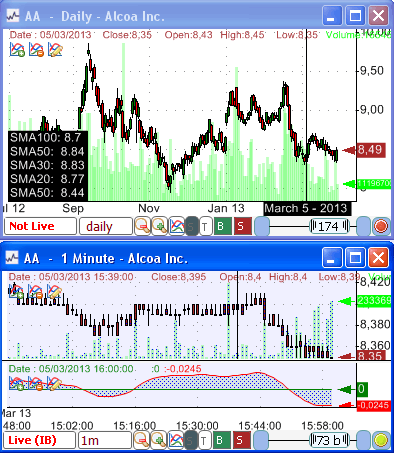
Let us say you are working with one-minute data and you want to calculate the intraday volatility (Average true range based on session high, low and close).
As you might have guessed, the calculation of the intraday volatility must be based on daily data.

Steps:

- Change the time frame to daily

TimeframeSet(-1);

We use negative time frame to reference daily data when working with intraday data (1 = 1-day period = daily)

- Calculate the average true range of the previous 10 trading days

a = atr(10);

- Restore the default time frame (one-minute data)

TimeframeRestore();

- Decompress the result so that daily data is synchronized with the one-minute data

a = timeframedecompress(a);


The complete formula is as follows:

TimeframeSet(-1);
a = atr(10);
TimeframeRestore();
a = timeframedecompress(a);
plot(a, "ATR");


There is also another way to implement the same thing. Here is the formula:

b = TimeframeApply(-1, atr(10));
b = timeframedecompress(b);
plot(b, "ATR", colorGreen);


The "TimeframeApply" function calculates a specific series in a different time frame. It replaces the "TimeframeSet" and "TimeframeRestore" functions.


Example of Strategy Using the True Range Indicator

Let us implement the following trading system:

- Buy when the intraday volatility as measured by ATR is increasing and when price crosses above 10-bar moving average
- Sell at the end of the trading session

Here is how to create a trading system:
How to create a trading system

And here is the formula that you should use to implement the above strategy:
rule1 = TimeframeApply(-1, atr(1) > ref(atr(1), 1)); // Ref: Reference previous bar's value
rule1 = timeframedecompress(rule1);
buy = rule1 and cross(close, sma(10));
sell = hour() >=16;


Update Chart Layout based on Active Ticker Symbol

$
0
0
You probably do not trade stocks like your trade futures or Forex currencies. It is also unlikely that you use the same indicators and rules for all assets.

If you agree with that then you will find the following article very interesting. This post describes a script that is implemented in QuantShare. This script will run on background and it will automatically update the chart layout based on the active symbol and a predefined list of symbols/layouts.

If you are still wondering what I am talking about, here is an example:

Let us say that when displaying stock charts, you often want to display the RSI indicator and two moving averages on the main pane. This is our default pane.
When displaying Forex charts, you want to display the number of stock tweets per day as well the correlation with another currency.
Our script will automatically choose the right layout for you when you select an asset. If you choose a stock then the first layout (RSI + Moving averages) is displayed and when you choose a currency such as the EURUSD, the second layout (Tweets + Correlation) is displayed.


What is Layout?

A chart layout is a file that contains information about how to display a chart.
How many panes it contains? What are the different formulas of each pane? What is the template of each pane? What is the chart's period?...

How to create a new layout:
To save the current chart's layout, right click on the chart, select "Layout" then "Save Layout As".

How to set a new layout to a chart:
Right click on a chart, select "Layout" then select an existing layout from the list.

How to set a default layout:
Right click on a chart, select "Layout" then "Set current layout as default". This layout will be used for example when you open a new chart using "View -> New chart".


How to Install the Script

- To open the script editor, select "Tools" then "Script Editor".
- Click on "File" then "New" to create a new script
- Type the script name then click on "OK"
- Paste the script (Click here to get the complete script)
- Click on "Execute" to run the script

It is preferable to add the script to the bookmark panel. This allows you to run it quickly from the main window. Here is how to accomplish this:
- In the "Script Editor"
- Select "Settings" then "Add current script to bookmark panel"

You may also instruct QuantShare to run this script when QuantShare trading software starts by creating a task using the task manager (Tools -> Task Manager).


How the Script Works?

The script contains several functions, which will be described later.

First, it loops indefinitely. In the loop, it gets the active chart and check if there is a layout associated with the chart's symbol.
If it does not find any layout, it uses the default layout as specified in the variable "defaultLayout", which of course you can change anytime by updating the script.
If it finds a layout, it checks if the current chart has a different layout and updates that chart with the layout associated with the active symbol (The symbol selected for the active chart).

The different functions created by the script are:

AddSymbol(string symbol, string layout)

Associates a symbol with a specific layout.

AddSymbol(string[] symbols, string layout)

Associates a list of symbols with a specific layout. Instead of calling the first function several times, you can create a list of symbols and then associate all these symbols to a single layout.

AddSymbol(Symbol[] symbols, string layout)

Associates a list of symbols (represented by "Symbol" class) with a specific layout.

GetLayoutFromSymbol(string symbol)

Returns the layout that was associated with the provided symbol. Returns "NULL" if the symbol is not associated with any layout.

RegisterChart(long id, string layout)

Informs QuantShare that the chart with the specified ID is associated with the specific layout. This prevents the script from updating the chart if its layout is already the right one.

IsUpdate(long id, string layout)

Gets whether to update the chart or not (changing its layout).


Update Layout based on Watchlists

Did you know that you could associate a watchlist to a layout?

For example, let us say that you have a watchlist that displays stocks that have a PER (Price earnings ratio) higher than 15.
You can create a layout that displays historical PER data as well as other fundamental and instructs the watchlist to use that layout anytime you choose a symbol from that watchlist.

To associate a layout to a watchlist:
- Right click on the watchlist
- Select "Settings"
- Type the "Layout" name
- Click on "OK"

Update Chart Layout based on Active Ticker Symbol - Part 2

$
0
0
In the previous post, we created a script that runs on the background. The script function was to change the chart's layout depending on the active symbol.

You can show different indicators depending on whether you are displaying on the chart a stock, a future, a small cap...

Let us go further with this script and add the ability to associate a list of symbols to a specific layout. You will no longer have to type symbols one by one to associate them to a specific layout. You will be able to create a list of symbols and with one line of code associate all the symbols in this list to a specific layout.


Symbols List

First, let us show you what is the list of symbols we are referring to.
Select "Symbol" then "Symbols View" to open a control that displays list of symbols (Also called Symbols Filter). Each list is based on one or several conditions. The securities that meet these conditions are included in the list.
Example:
- Securities whose ticker name starts with "A"
- Stocks that belong to a specific industry
- Stocks that are part of the S&P 500 Index
- Securities that increased by more than 1% in the previous day

To create a new list of symbols, right click on the control then select "Create a new symbols filter".

Associate a list to a layout

Now that you have created one or several lists, let me show you how to use these lists and associate them with a particular layout, so that each time you select one of the securities that belong to a list, its corresponding layout is automatically reflected on the chart.

- Select "Tools -> Script Editor"
- Click on "File -> New" then enter a new name for our script
- Paste the script code (download it here)
- Click on "Execute" to run the script (Here is how to add the script to the bookmark panel: Click here)

Compared to the previous script we have uploaded few weeks ago, the current one has one additional method, which is:

AddSymbol(string listName, string listCategory, string layout)

The function takes the category and name of a symbols list, retrieves all symbols in the list then associates each one of them to the layout you specified in the same function.

Example of usage:

At the beginning of the script, you can type the following line to associate stocks from "Gold List" to a layout named "gold".

AddSymbol("Gold List", "", "gold");


How to keep the same time frame when changing layout

Besides all the visual settings, a layout also stores important data such as the ticker symbol, the number of bars to display and the chart's period. This means that each time you change a layout; the chart will be updated with the new layout's period. If you are using an EOD chart and the layout you are going to load was saved under a one-minute chart then the new chart will show one-minute data too.

Many traders wouldn't want the period or time frame to change when switching layouts. This can be accomplished by following these steps:

In the formula script, there are two calls to the following function:
"App.Main.UpdateChartLayout"

- Before each call, type the following lines:

int currentTimeframe = chart.TimeFrame;
bool isHistorical = chart.IsHistorical;


[This is to save the current time frame]


- After each call, type the following lines:

chart.TimeFrame = currentTimeframe;
chart.IsHistorical = isHistorical;
chart.Update();


[This is to restore the old time frame and update the chart]

You can find the complete code here.

How to Pick the Best Trend Indicators

$
0
0
Trend indicators are primarily used to identify the direction of a security by smoothing the volatility of the price action. These indicators are usually referred to as lagging indicators because their calculation is based on past price data.

The most known trend indicator is the moving average; there are several types of moving averages such as the simple, exponential, double or weighted moving average. But there are also many other trend indicators used by technical analysts.

These technical indicators usually get one or several periods for their internal calculations. Higher period values are used for long-term analysis while low period values are used for short-term analysis.


Moving Average

As we previously said, the moving average is the best known indicator to detect trends. It is simply the average of the N-previous bars.
There are several ways to use the moving average; we could detect the crossover of a moving average with another one, or the crossover of a moving average with the price series...

Example of rules using QuantShare:
cross(close, sma(25))
cross(sma(25), sma(50))


Directional Movement Index (DMI)

By comparing today's high and low prices against previous day's high and low, the DMI is a technical indicator that measures the direction and strength of a trend. DMI is based on the theory that says that an uptrend is formed by higher highs and a downtrend is formed by lower lows.

Example of rule using QuantShare:
cross(Plus_Dm(14), Minus_Dm(14))


Average Directional Index (ADX)

The average directional index shows the strength of a trend. ADX indicates a moderate strength trend when its value is above 30. It shows a strong trend if the value is above 40. In that case, the trend is likely to continue.
Note that the ADX is part of the DMI indicator and as we said it shows the strength of a trend but it doesn't indicate the direction of the trend.

Example of rules using QuantShare:
adx(14) > 40
adx(14) > 40 and cross(Plus_Dm(14), Minus_Dm(14))


Aroon Indicator

The aroon indicator is made up of two lines. The "Aroon up" measures the strength of the uptrend and the "Aroon down" measure the strength of the downtrend. Each line calculates, in percentage, the time it takes the price to reach the highest or lowest point in a given time period.

Example of rules using QuantShare:
cross(AroonUp(14), 50)


Percentage Price Oscillator

The percentage price oscillator or PPO shows the difference, in percentage, of two exponential moving averages.
It is very helpful particularly when comparing stocks together. You can for example use it to create market composites or to rank stocks in your trading system.

Example of rules using QuantShare:

ppo(14, 50, _MaSma) > 5
=> The short term moving average is 5% above the medium-term average.


How to create a list of trading rules

Now that we have listed few trend indicators, let us create a list of rules.

To create a new list of rules, select "Analysis" then "Rules Manager".
In the new control, click on "Create", type the list of rules name then select that list from the "List of Rules" panel. Use, the right control to add trading rules. You can add the rules have described in the above examples and of course you can add trading rules based on other trend indicators.

A list of rules containing the above example can be downloaded here:
1291

More technical indicators can be created by using masks and optimizing the different parameters. Here is how to do that:
How to create and backtest thousands of trading rules in less than 10 minutes


How to analyze each trading rule individually

While you are still using the "Rules Manager" control, select your list of rules then click on "Analyze the list".
Select the list of stocks or securities to analyze as well as the start/end dates and the time frame (daily, weekly or intra-day).
Click on "Continue" to start analyzing each trading rule individually.

It is also important to define an exit rule. For this, select "Outputs" tab in "Rules Analyzer Settings" form, click on "Select Outputs/Exit rules".
To define an N-bar stop (For example: Enter when the rule is true and exit after 10 bars), select "Performance, use N-Bars stop", click on "Add" then set "10" under "Number of bars" column. Click on "OK" to save your settings.

Note that you can define several exit rules. In that case, for each trading rule, you will get several reports; one for each exit rule. Each exit rule is analyzed individually.

Once completed, you will have a better idea of which trading rule performs well. You can also create a new list of rules based on the top performing ones.

More info: Introduction to the trading rules analyzer


How to select the best combination of trading rules for your trading system

The last step would be to include one or several of these trading rules into your trading system. You can even perform an optimization looking for the best rule or combination of trading rules that has the best performance.

The following blog posts show you how to add trading rules into a trading system and how to optimize them:
How to choose which technical indicators to use in your trading system
How to turn any ordinary trading strategy into a very profitable one


The opposite of a trending market is referred to as a ranging market. In a future post, we will write about how to detect ranging markets and which indicators to use for that.

Learn How to Create Your Own Technical Analysis Indicators

$
0
0
Today, we will show you how to implement custom functions in QuantShare by creating two popular trading indicators.
Custom functions can be implemented using C# programming language. The result is a function that can be used in the QuantShare programming language. You know, the easy language you use when creating charts, composites, trading systems...

There are several reasons why someone would want to create a technical analysis indicator using C#. Here are few of them:

- To have one single function to use instead of several lines of code
- To create advanced indicators that cannot be created using QuantShare programming language
- To protect the source code of your indicator


Simple Moving Average

The simple moving average (SMA) is a very popular trend following indicator that shows the direction of a trend.

The SMA indicator is already built-in QuantShare, however, we wanted to show you how to implement it from scratch using the custom indicators tool.

The SMA formula is as follows: Average of last N-bar values

To create a new custom indicator:
- Select "Tools -> Create Functions".
- Click on "Add", type the function name "SMA1" then click on "Save".

Note that we cannot use "SMA" as a name for our function because this keyword is reserved (Remember that there is already a built-in function called "SMA").

After you create the indicator/function, you can type the C# script in the right panel. Below that panel, you can define the parameters that will be passed to the function. In our case (Simple Moving Average), we only need one parameter, which is the lookback period.

Let me show you now the C# code that you must copy in order to create the SMA indicator:

- First of all, add one parameter (set "Period" as name)
- Type the following code:

int p = (int)Period[0]; // All parameters are passed as vectors. Here we are passing a numeric value and thus we can get that value by getting the first element of the "Period" vector
VectorD close = cFunctions.Close; // Gets the close series
for(int i=p-1;i < result.Length;i++) // Loops through each trading bar
{
double sum = 0;
for(int j=i-p+1;j < =i;j++) // Loops through the last "p" elements of each trading bar
{
sum = sum + close[j]; // Sums previous close values
}
result[i] = sum / p; // Calculates the average of the past close values (SMA)
}


Each line of code is followed by a brief description that explains what exactly this line does.
Click on the "Save" button to compile and save your indicator.


Percentage Price Oscillator

Percentage price oscillator is a momentum indicator that simply calculates the difference between two moving averages in percentage.

The PPO formula is as follows: (Short Exponential Moving Average - Long Exponential Moving Average) / (Long Exponential Moving Average)

In QS programming language, PPO (9, 26) can calculated as follows:

ppo2 = (ema(9) - ema(26)) / ema(26);

But because we do want to replace this line by something like (ppo2 = ppo(9, 26);), let us create a custom function to calculate the PPO indicator.

As usual, open the "Create Functions" tool and create a new function (PPO1). Do not use "PPO" keyword because the percentage price oscillator is already built-in QuantShare.

Here is the C# formula of the PPO indicator:

VectorD st = TA.Ema(p1);
VectorD lt = TA.Ema(p2);
result = (st - lt) / lt;


You must also add two parameters (below the script editor).
"p1": Short-term period
"p2": Long-term period.
These parameters will be passed to the function and as you can see, they are used to calculate the different exponential moving averages.

In this example, we have used the "TA" class. This class contains several built-in functions and indicators.

We could have implemented the first example (SMA) by simply typing:
result = TA.Sma(Period);

Note that at any moment, you can use the CONTROL+SPACE shortcut to display the list of available functions/parameters.


How to Reference a Custom Indicator in QuantShare Programming Language

Let us see how to plot a custom indicator in a chart.

- Right click on a chart then select "Create new pane"
- Right click on the new pane then select "Edit Formula"
- Type the following formula:

a = ppo1(9, 26); // This is the call the previously created "ppo1" C# function
plot(a, "PPO", colorBlue);


- Click on "Update Graph" to add the PPO indicator to the chart


How to Protect your Source Code


- In "Create Functions" form, click on "Manage" button (Top bar)
- Select one or several indicator you want to protect/encrypt
- Select "Tools -> Encrypt checked items" (If you do not see the "Tools" button on the top menu, click on "+" icon to expand the menu)
- Click "Yes"
- Enter your password then click on "OK"

Now, each time you select that indicator in "Create Function" control, you will be prompted to enter a password. Otherwise, you will not be able to see the indicator C# code.

Note that even if an indicator is encrypted, you can still use it in your charts, trading systems, composites, watchlists and any other tool.

How to Download Trading Data for Certain Securities Only

$
0
0
Downloaders implemented in QuantShare can retrieve any kind of data. The downloader tool is powerful and can create any sort of data retriever. You can for example, create an item to download data for specified symbols or an item that downloads a big compressed file that contains historical EOD data. That file will be automatically decompressed, read, parsed then its data added to a custom or built-in database.

An example of such downloader is the 1111, which downloads historical EOD data for U.S. stocks. This item gets data by date, which means that on each request it gets trading data that occurred on that specific date. These kinds of items usually get data for all securities supported by the data provider. This means that you run the downloader; it will add and update trading data for all U.S. stocks.

But, let us say you want to update only S&P 500 stocks. How to do that?

In this post, I will show you how to update the downloader so that it downloads data only for the securities you choose. Of course, you can apply the same technique to other downloaders.

There are two ways to accomplish this.


Basic Technique

This technique consists of telling the downloader to download data only for stocks available in the database.
In our case, we must remove all securities except S&P 500 stocks. You can do that using "Symbol -> Manage Symbols".

After removing these securities, follow the next steps:
- Select "Download -> Download Manager"
- Select "Daily US Stocks Data"
- Click on "Update"
- Click on "Parser" button under "Parser" column
- Select one URL to debug (These are the URLs used to get data)
- Click on "Next"
- In the "CSV Settings" control, uncheck "Automatically add new symbols"
- Click on "Next" until the form closes
- Click ok "OK" to save the download item


Advanced Technique

The advanced technique consists of passing a list of ticker symbols to the downloader and asking it to download data only for symbols within this list.

- Select "Download -> Download Manager"
- Select "Daily US Stocks Data"
- Click on "Update"

How to bring the Symbols tab to the downloader

Click on the button under "Fields" column then add a new field by clicking on the "Add Field" button.
Set the new field's name to "symbol" then update its type and set it to "Symbol".
By defining a "Symbol" field, you have just instructed QuantShare to add a symbols tab to the downloader.

How to avoid running a request for each symbol

Now that we have defined a symbols tab, the URL-Script, which is the script the downloader uses to get URLS dynamically, will be executed for each symbol. Since our downloader do not requires symbol names to create URLs, the same request (For example download 20-05-2013 data) will be executed several times, once for each symbol.

We don't want that and we must tell the downloader that the URL-Script should be executed only once.
- Click on "Settings" button under "Settings" control
- Check "Load the script only once"
- Click on "OK"

Saving the list of symbols

The main idea of the advanced technique consists of saving the list of symbols so that we can pass it to the "Pre-Script", which is responsible for updating/modifying data just before it is analyzed.

- Click on "Settings" button under "Settings" control
- Click on "Create a URL-Script"

There you will find the code source used by this download item to dynamically generate URLs.

Add the following line at the end of the script:
Global.SetVariable("DownloaderSL", Functions.GetAllValues("symbol"));

// Functions.GetAllValues: Gets a list of all symbols defined in the "Symbols" tab (You see this tab when you open a downloader)
// Global.SetVariable: Creates a global variable and stores data in it. The global variable can be used any QuantShare script.

Reading the list of symbols


Let us open the parser settings control
- Click on "Parser" button under "Parser" column
- Select a URL then click on "OK"
- Click on "Next"
- Click on "Pre-Script" button

Add the following code at the bottom of the script:

string[] list = (string[])Global.GetVariable("DownloaderSL");
for(int i=0;i < list.Length;i++)
{
list[i] = list[i].ToUpperInvariant();
}
for(int i=0;i < Content.Rows.Length;i++)
{
string symbol = Content.Rows[i].Data[0].ToUpperInvariant();
if(Array.IndexOf(list, symbol) < 0)
{
Content.Rows[i].IsIgnoreLine = true;
}
}


- Click on "OK", "Next" then "Finish"
- Click on "OK" again to save the download item

Now, select your download item, click on "Open Selected Downloader", select "Symbols" tab, choose your symbols then click on "Start Downloading" to get end-of-day data for the selected symbols only.

Quantitative Analysis: Price Channels

$
0
0
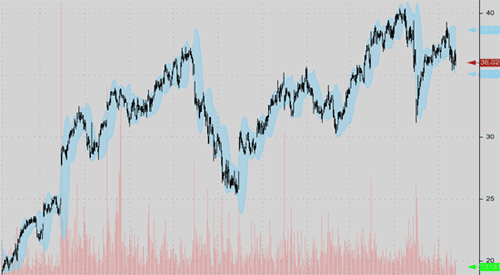
One of their major strength is their ability to use both price action and volatility. Price bands or channels are trading indicators composed of two lines. The upper line is a sort of resistance line (Area of abundant supply) while the lower line is a sort of support line (Area of strong demand).

Over years, technical analysts have developed several price channel indicators; some of these include the Bollinger bands, Donchian channels, Keltner Channels, Volatility Channels, Standard Error Bands, Adaptive Price Channel and Moving Average Envelopes.


Bollinger Bands

Probably, Bollinger bands is the most popular one. Its middle line is simply a moving average.
By calculating the standard deviation of past prices and adding/subtracting it to the middle line, we can build the upper/lower line of the Bollinger bands.

Bollinger bands indicator is built-in QuantShare. Here is how to reference this indicator in QS language:

Upper Line:
BBandsUpper(20, 2, _masma)

The above line creates the upper band by adding 2 standard deviations to the 20-bar simple moving average.

Lower Line:
BBandsLower(20, 2, _masma)


Donchian Channels

Donchian boundaries are based on high and low of previous N-Periods.

The indicator can be downloaded here: 300

Upper Line:
donchian_channels(20, 1)

Lower Line:
donchian_channels(20, -1)


Keltner Channels

Keltner boundaries are set around a moving average. It is based on the average true range or the high/low range.

The indicator can be downloaded here: 583

Upper Line:
KeltnerChannel(close, 20, 2, 1)

Lower Line:
KeltnerChannel(close, 20, 2, -1)


Volatility Channels

The volatility channels use the highest and lowest previous values to determine the upper and lower lines.

The indicator can be downloaded here: 971

Upper Line:
VolatilityChannels(20, 0)

Lower Line:
VolatilityChannels(20, 1)


Standard Error Bands

This price channel indicator is based on the alpha and beta coefficients of the linear regression of the past N-prices.

The indicator can be downloaded here: 289
It also requires the following functions: 288 and 287.

Upper Line:
standard_error_bands(20, 2, 1)

Lower Line:
standard_error_bands(20, 2, -1)


Adaptive Price Channel

The adaptive price channel uses the highest high and lower low values of the price series over a non-fixed lookback period. The lookback period follows changes of the 30-bar standard deviation of the close series.
The indicator can be downloaded here: 824

Upper Line:
Apc(40, 10, 1)

Lower Line:
Apc(40, 10, 0)


Moving Average Envelopes

It is based on 2 exponential moving averages. The distance between the upper and lower moving average is expressed in percentage.

Upper Line:
mult = 2;
up = ema(20);
up = up * (1 + (mult / 100));


Lower Line:
mult = 2;
down = ema(20);
down = down * (1 - (mult / 100));


How to Trade with Price Channels

There are several ways to trade price channels. The most used buy and short rules are:

Enter long when the price breaks upper band (Uptrend with strong bullish pressure)
Enter short when the price breaks lower band (Downtrend with bearish pressure)

Of course there are other ways to trade price channels, but for now we will stick with the above rules.


Comparing the Different Price Channel Indicators

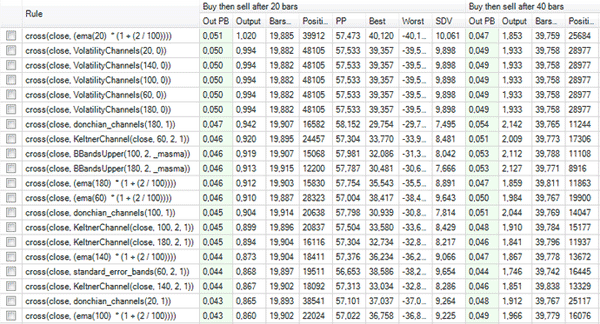
We are not going to compare the so-called advantages and disadvantages of each price channel indicator. We want numbers and that is why we are going to backtest each indicator against S&P 500 stocks to discover which one performs best.

To conduct this test, we will create a list of rules then use the rules analyzer tool to assess the performance of each rule.

- Select "Analysis" then "Rules Manager"
- Click on "Create", type "Price Channel" then click on "OK"
- Select "Price Channel" list of rule then add rules one by one in the right panel

Example of rule:
cross(close, donchian_channels(20, 1))

The above rule generates a signal when the price crosses above the upper line of the Donchian channel.

You can download directly a ready-to-use list of rules here: 1300
It contains a rule for each price channel indicator plus several variations of the lookback period.


Quantitative Analysis

Now that our list of rules is ready, let us do some quantitative analysis. We are not going to do a true-portfolio backtesting but instead we are going to analyze each rule and backtest it against S&P 500 stocks.

The difference between true-portfolio and individual backtesting is that in the latter case the simulator engine will analyze every trade and it will not take into account portfolio's requirements and settings such as the number of positions, capital...

- Select your list of rules then click on "Analyze the list"
- In "Symbols & Period" section, select the start/end dates then select S&P 500 stocks (You can do that by adding an "Index" condition then selecting S+P 500)

Note that if you do not see "S+P 500" then it is probably because your list of symbols is not associated with indices.
To update your symbols, select "Symbol -> Auto Manage Symbols". Check the exchanges you are trading (Example: NASDAQ, Amex and NYSE), check "Force the update of symbol information" then finally click on "Save".

- Back to the rules analyzer tool, click on "Outputs" tab after selecting the simulations dates and the S&P 500 stocks
- In the "Outputs" tab you can select your exit rule (When you select multiple exit rules, you will get a report for each rule)
- Click on "Continue" to start the backtesting/analysis process


4 Links to Download Free Historical Stock Prices Data by Date

$
0
0
Several months ago, I have created a post and listed 10 websites that provide historical stock quotes data free. These websites include the popular Yahoo finance and Google finance websites.

If you used one of these websites to gather historical data then you already know that you can only download data for each stock individually. I mean there is no way to get a file that compiles trading data for all stocks for a particular date.

If you are interested in getting historical stock prices data compiled by date then keep reading.

First of all, let us answer the following question:

Why it is useful to get historical stock prices by date?

Because, it is much faster to download if you don't need a lot of historical data (1000 requests for 4 years compared with about 8000 requests if you do get historical data for U.S. equities - One request per stock). In addition, you just have to download only file per day to make your historical database up-to-date.

This was my answer and if you have more reasons fell free to add them in the comments.


Netfonds

Netfonds is a Norwegian financial websites that cover several markets including U.S. stocks, Funds and some European markets.

Downloading data by date is possible in Netfonds, but you will have to download three files, one for each U.S. exchange (NASDAQ, NYSE and AMEX).

- Visit the following Exchange Quotes Link
- Select "NASDAQ" under "Exchange" column
- Select a date
- Select "CSV" under "Format" column
- Click on "Update"

You will get historical stock prices from the following URL:
http://www.netfonds.no/quotes/exchange.php?exchange=O&at_day=11&at_month=6&at_year=2013&format=csv

To get data for other markets simply update the "exchange" parameter in the above URL.

NYSE quotes: exchange=N
Amex quotes: exchange=A

As you can see from the above URL, the other parameters simply define the day, month and year of the requested data.

Netfonds doesn't provide OTC data and its historical quotes data is available starting from 2001.

You can use the following QuantShare downloader to get historical data:
1111


Stooq

There is no English version of the Stooq website. Please follow my instructions so that you do not get lost.

- Open your browser and enter the following URL: http://stooq.com/db/

In Stooq, you can either download the last data files (one per trading day) one by one or you can download the whole historical database in ASCII or Metastock format.
To get the whole historical data, visit the following link: http://stooq.com/db/h/

There, you can download daily stock prices for U.S. stocks as well as Japan/Germany/Poland/Hungary stocks, commodities, futures, Forex and macroeconomic indicators.

Here is how to read data from Metastock databases in QuantShare:
How to use QuantShare with Metastock data


Barchart

Barchart is a popular data provider that sells EOD, Intraday and real-time data for several exchanges.
Although most of its services cost money, Barchart provides EOD data for U.S. stocks free.

Here is what you need to do in order to get access to this data:
- Open barchart.com
- Click on "Join Now" then open a free account
- Complete the registration process then visit the following page:
http://www.barchart.com/historicaldata.php?sym=&view=historicalfiles&txtDate=

- Select a date, click on "Get Data" then on "Stocks", "Mutual Funds" or "OTC Stocks" to download historical quotes data per date.

At least 5 month worth of end-of-day data are available for download. The data for the current trading day is usually available after 6:00 PM Eastern Time.


EOD Data

EOD data is also a paid service but offers free historical data for recent days in exchange of a free registration.

To download and test historical quotes data provided by EOD Data, open a free account @ eoddata.com

With a free account, you can get end-of-day data available at 09 PM (local exchange time) for U.S. Equities, Global Indices and Foreign Exchange.
Note that historical data is only available for the past 30 days.


More Resources to Get Historical Prices Data

If you want to download end-of-day data by ticker symbol then take a look at this great list of free resources:
10 ways to download historical stock quotes data for free

Interested in intraday and tick data for the U.S. stock market, take a look at this:
6 ways to download free intraday and tick data for the U.S. stock market

There are also several free websites providing end-of-day and intraday data for the Forex markets. These websites are compiled here:
6 places to download historical intraday Forex quotes data for free

Finally, if you are trader from Germany or interested in trading stocks listed on German stock exchanges, then we have something for you:
German Stock Exchanges: 5 free ways to download historical EOD/Intraday data

Backtesting a Strategy Based on Bond and Stock Index ETFs

$
0
0
Nowadays, correlation between markets and different assets is more obvious than never before. A move in oil price for example is likely to impact several markets including the stock and bond markets.

For this reason, and many others, it is important to learn how to create and backtest trading strategies based on different assets. In this post, I will show you how to trade a stock index ETF based on the movement of a Bond ETF.

I chose these two markets because there is a strong relation between stocks (represented here by a stock index ETF) and bonds. Many traders and investors own bonds and stocks. They sell their stocks and buy bonds when inflation rises (bonds are more attractive because of higher interest rates) and they sell their bonds and buy stocks when inflation decreases.


Bond and Stock Index ETFs

The trading strategy consists of buying the SPDR S&P500 Index Trust (SPY) if the following two conditions are met:

- SPY shows a 10-bar return lower than 2%
- The ETF bond (iShares Barclays 20+ Year Treasury Bond ETF) shows a positive return for the past 10 trading bars

The exit rule consists of 10-bar N-Stop, which means that any SPY position is closed after 10 bars.

First of all, we must download end-of-day data for these ETFs. If you already have the necessary data, please move to the "QuantShare Trading System" paragraph.


Getting Symbols & Historical EOD ETFs Data

- Select "Symbol -> Auto Manage Symbols"
- In exchange list, select "Exchange Traded Funds"
- Click on "Save"

QuantShare will add ETF symbols and the EOD downloader to your account. You will be promoted to start downloading data, click on "Yes".


QuantShare Trading System

For those who are not familiar with the QuantShare programming language, I suggest you take a look at the following post:
QuantShare Programming Language Tutorial

If you haven't yet implemented and back tested trading systems in QuantShare, please check the following posts:
How to create a trading system
Example of a trading system


Since our trading system trades only SPY, then we should add only this ETF in "Symbols" panel (under "Symbols & Dates" tab). We must also set the "Number of positions" field to "1".
The first buy rule can be implemented like this:

rule1 = perf(close, 10) < 2;

// "perf" or "roc" is the function that calculates the performance/return. In this case, the return is for the past 10 trading bars.


The second rule references an external symbol, which is the ETF Bond (TLT: iShares Barclays 20+ Year Treasury Bond ETF).

To get the price series of an external symbol, we can use the "GetSeries" function:
a = GetSeries("TLT", close);
rule2 = perf(a, 10) > 0;


As with the first rule, we used the "perf" function to calculate the return of the ETF bond over the past 10 trading bars then we compare it with "0" threshold.

Here is the complete strategy's formula:

rule1 = perf(close, 10) < 2;
a = GetSeries("TLT", close);
rule2 = perf(a, 10) > 0;

buy = rule1 and rule2;


// Enter long only if rule1 and rule2 conditions are met

For the exit rule, you just have to select "N-Bar Stop" and set a stop value of 10 (below the formula control)


Backtesting and Optimizing the ETF-based Strategy

Once you click on the backtest button in the simulator manager, the backtester process starts and in few seconds, you will get your simulation report.


Now, if you look back at the formula, you might notice that several values can be changed. We may for example change the return period (which is 10) or we can optimize the "higher than" or "lower than" thresholds.

More about optimizing a strategy can be found here.

Here is how our formula looks like after setting optimizable variables:

Optimize("op1", 5, 50, 5);
Optimize("op2", -5, 5, 1);
rule1 = perf(close, op1) < 2;
a = GetSeries("TLT", close);
rule2 = perf(a, op1) > op2;

buy = rule1 and rule2;


Even the N-Bar stop can be optimized. Note that you can include the N-Bar stop directly in the formula (Without using the stops control) by using the following instruction:

SetSimStop(_StopNBar, _Point, 10, 0);

This can be helpful for example if you want to use the variable "op1" to optimize the stop rule.

How to Switch On/Off Trading Rules in Your Stock Trading System

$
0
0
The AI optimizer tool of QuantShare is capable of building a trading system based on a list of buy, sell, short and cover rules. It will optimize your trading system based on the defined fitness function by switching on and off the trading rules you provide.

The fitness function is user-defined and it is a measure the AI optimizer uses to determine which the best trading system is. You can for example choose Annual Return, Sharpe Ratio or any custom trading measure to be your fitness function.

Here is how to AI optimize works:

- Select "AI" then "Optimize"
- In the optimizer control, click on "Create" button
- Select one of the available artificial intelligence algorithms (Genetic Algorithm or Population-Based Incremental Learning)
- Under "What do you want to optimize?", select "Trading System"
- Click on "Next" twice
- Next to "How to optimize your trading system", choose "Using buy & sell list of rules"
- Define the number of buy, sell, short and cover rules
- Finally, specify a list of rules for each gene by clicking on the "Select Rules" button

Click here for more information about how to create trading rules.


Today, I wanted to show you another way to do this using the simulator tool only. Unlike the AI optimizer, which uses artificial intelligence algorithms to try to come up with the best combination of rules, this method performs exhaustive optimization and thus backtest every combination of your trading rules.

But, let us start first by creating a simple trading system to demonstrate this technique.


Trading System

The trading system that we will use in this post contains the following rules:

- Price between $5 and $50
- Relative Strength Index (RSI) higher than 70
- Price above its 25-Bar simple moving average
- Price is at a one month high
- Price return for the past 10 bars is positive


The complete QuantShare formula is:

rule1 = close >= 5 and close <= 50;
rule2 = rsi(2) > 70;
rule3 = close > sma(25);
rule4 = (close == hhv(close, 25));
rule5 = roc(10) > 0;

buy = rule1 and rule2 and rule3 and rule4 and rule5;

// Sell after 10 bars
SetSimStop(_StopNBar, _Point, 10, 0);


Click here to learn how to create a trading system.


How to Switch On/Off Your Stock Trading Rules

To demonstrate how to switch on and off a trading rule, let us take the second rule for example.
This rule tells QuantShare to enter long if RSI is higher than 70.

In order to switch off this rule, we must make sure that it always return "1" or TRUE.

Why not "0" or FALSE?
Because, in that case, turning off a rule will turn off all the others. Take a look at the "buy" variable; if one rule is equal to 0 then the buy variable will be automatically equal to 0.

Switching off a rule can be accomplished by adding the following instruction to our rule:

rule2 = rsi(2) > 70 OR 1; // No matter the result of the RSI comparison, "rule2" variable will always be equal to 1

Example:
On day 1: RSI rule returns TRUE then rule2 = TRUE OR TRUE = TRUE
On day 2: RSI rule returns FALSE then rule2 = FALSE OR TRUE = TRUE

To switch on the same rule, we just have to do the following:

rule2 = rsi(2) > 70 OR 0;

Example:
On day 1: RSI rule returns TRUE then rule2 = TRUE OR FALSE = TRUE
On day 2: RSI rule returns FALSE then rule2 = FALSE OR FALSE = FALSE

Now, the most interesting part is how to automate the switch on/off process of our stock trading rules.

It is easy for those familiar with optimizations and the "Optimize" function. However, those who are not, let me introduce you the "Optimize" function.

This function allows you to create several variations of a variable. If for example you create a simple trading system that compares the stock's price with a threshold value and you want to test different threshold values then the "Optimize" will come to the rescue.

Here is how:

Optimize("a", 10, 30, 10); // Starts at 10, increments by 10 until it reaches 30
buy = close > a;


When optimized, this trading system will be backtest three times (a=10, a=20 and a=30).


Combination of Stock Trading Rules

Switching a rule on/off is the first part of this strategy. The second part consists of automating this process. For this, we will use the "Optimize" function. If you still don't know what this function does, please read the previous paragraph again.

Here is the complete formula with the different optimizable variables:

rule1 = close >= 5 and close <= 50;
rule2 = rsi(2) > 70;
rule3 = close > sma(25);
rule4 = (close == hhv(close, 25));
rule5 = roc(10) > 0;

Optimize("a1", 0, 1, 1);
Optimize("a2", 0, 1, 1);
Optimize("a3", 0, 1, 1);
Optimize("a4", 0, 1, 1);
Optimize("a5", 0, 1, 1);

rule1 = rule1 or a1;
rule2 = rule2 or a2;
rule3 = rule3 or a3;
rule4 = rule4 or a4;
rule5 = rule5 or a5;

buy = rule1 and rule2 and rule3 and rule4 and rule5;

// Sell after 10 bars
SetSimStop(_StopNBar, _Point, 10, 0);


Add this formula to your trading system, save it then click on "Optimize" button in the simulator manager.

Here is the report after backtesting this trading system:


In the second line, "a1" is equal to "1", which means that the first rule is switched off. All other variables have a value of "0", which means the other rules are switched on.
In case all rules are switched off, the trading system will enter any stock and at any bar (buy rule will always be equal to 1).

How to Automatically Import Local Data Into QuantShare

$
0
0
The downloader tool, one of the best features of QuantShare, let you retrieve data from Internet and add it to the quote or any custom database. But did you know that you can use the downloader tool to automate importing data files from your hard drive?

By simply replacing a URL by a file path, you can use the downloader tool to read files data and import that data into your database.

Here is what you will learn in this blog post:

- Using the downloader to parse local files
- Import all files in a specific directory
- Automate data import


How to create a downloader to parse local files

- Select "Download -> Download Manager"
- Click on "Add"
- Click on "Add URL"
- Under "URL" column, type the file you want to parse. Example: c:\data\appl.csv
- Under "Content Type", select "CSV" or "Zip" if the files you want to parse are compressed
- Click on "Parser" button under "Parser" column
- In "Parser Settings", specify the correct settings to successfully parse the file

If the symbol name of each security is specified in the file content then you simply have to reference it within parser settings ("Quotes -> Symbol" column). Otherwise, you must update the downloader so that the symbol name is picked from the file name.

In the latter case, set the file location to:
C:\data\[SYMBOL].csv

Click on "0 Field(s)" under "Fields" column then add a new field. Set the field type to "Symbol" then type a symbol to test under "Value" column. Also, uncheck the option under the last column.

Now, that we have parsed a single file, let me show you how to parse several files using a single downloader.


Import all files in a specific directory

- Select the downloader we have previously created then click on "Update" in the download manager.
- Click on "Settings" button under "Settings" column
- Click on "Create URL-Script"

This script allows you to dynamically create URLs or file paths to parse.
- Type the following script then click on "OK"

string[] files = System.IO.Directory.GetFiles(@"C:\data\", "*.csv");
int count = files.Length;
for(int i=0;i < files.Length;i++)
{
string file = files[i];
Functions.AddURL(file, "Parsing: " + i + "/" + count);
}

As you can see from the above code, the directory location is specified in the first line. The "GetFiles" function returns all files with the "csv" extension. If your files have another extension then simply update the "*.csv" value with "*.[extension]". To read all files, type "*.*".


Automate data import

If you want to import data every day (or every few minutes/hours) then you will be probably interested in automating this process. The script editor is a QuantShare tool that allows you to create scripts to control QuantShare and automate things. The script we will implement now, simply starts a specific downloader. If you mix that tool with the task manager then you will be able to create a task that automatically starts any downloader at a specific time.

- Create a new script using "Tools -> Script Editor"
- Add the following code to your script:

Downloader.StartDownloader("Name");

// Replace "Name" by the name of your download item

- Now, open the task manager by selecting "Tools -> Task Manager"
- Click on "Click here to add a task"
- Select the "Minute/Hour/Week/Month" settings
- Click on "Add" under "Scripts to be executed"
- Select the previously created script then click on "Add" under "Task" panel to create your new task

If you have any questions then please add them below.

Different Ticker Symbols for Each Data Source

$
0
0
For one reason or another, some traders may require having two different set of symbols, one for each data source. Let me explain how to implement this in QuantShare by taking an example. The user in our example have two different data sources (Yahoo and Metastock). He wants to get historical quotes from Yahoo and from a Metastock database at the same time in order to compare it. He also want to have two symbols for each stock, one for each data source. This means that for example he may have "GOOG" for Metastock and "GOOG-Y" for Yahoo data.


How to set up a metastock database

Setting a metastock database is very easy in QuantShare. You can find full instructions here.
Once your database folders are set, you can select whether to add new symbols to your database or not. Keep the option checked to add new symbols to your local database.

Select a symbol and open a chart to display data from the new Metastock database. You should see "Metastock" printed on the chart (top-right corner) if the data comes from the metastock database. If you see nothing then the data is loaded from the local database and this also means that there are no quotes for the selected symbol in the metastock database.


How to get historical data from Yahoo

Historical EOD quotes can be downloaded from Yahoo using the following item: 463. This is QuantShare�s default downloader. This downloader gets symbol name from the "Name1" field. In case this field is empty, it gets symbol name from the default "Name" field.

What is "Name1"? In QuantShare, there is the default field (Name) to store symbol names but there are also several other fields (Name1, Name2 and Name3). These fields can be used in case there are several variations of the symbol name. You can use them to store for example unique identifiers like the CUSIP and to differentiate assets with the same symbol name (Example: a US stock and an International stock).


Creating a different set of symbols for Yahoo data

We will keep original symbols for the Metastock database and update ticker symbols used by the Yahoo downloader.

First, we must export the list of symbols and change the ticker symbol of each security.

- Create a new basic watchlist and add all symbols that you want to use with the yahoo downloader
- Right click on the watchlist then select "Copy all symbols to the clipboard"
- Now, you must append "-Y" to every ticker symbol. You can automate that by copying the symbols list in Excel, adding "-Y" to a second column, copy it to all rows then merging the result by copying both all rows in both columns then pasting it in a text editor.
- Perform the same operation to add the original name to each ticker symbol

Example of Result:
AAPL-Y;AAPL
GOOG-Y;GOOG
C-Y;C

- Save the result in a file
- In QuantShare, select "Symbol -> Import symbols from a file"
- Type ";" next to "Data must be separated by"
- Click on "Load File" and select the previously created file
- Under "Symbols" tab, select "name" (first row) for the first column and "name1" for the second column
- Click on "Create List" button at the bottom
- Type a name then click on "Save"
- When you are prompted to add the symbols to the current account, select "Yes"

- Select the "Historical Stock Market Data" downloader in the download manager (This is the Yahoo downloader)
- Click on "Open Selected Downloader"
- Select "Symbols" tab
- Remove any existing conditions then add a "Symbol Info" condition
- Select "Name" under "Values" then type "*-Y" next to "Search:"

This will allow you to select all stocks whose ticker name ends with "-Y".

You should now have 2 ticker symbols for each stock.
Example:
AAPL and AAPL-Y
GOOG and GOOG-Y
C and C.Y


When selecting "AAPL", data from Metastock will be loaded, and when you select "AAPL-Y", data from local database (Yahoo data) will be loaded. Remember, we said that Yahoo downloader gets symbol names from "Name1" field and thus when downloading data for "AAPL-Y", it will in fact uses "AAPL" as symbol name.


Comparing historical data from different data sources

The best way to compare historical data from the different data sources is by plotting them on the same chart.

- Create a new chart then select a stock (Example: GOOG)
- Create a new pane by right clicking on the chart then selecting "Create new pane"
- Right click on the new pane then select "Edit Formula"
- Type the following formula then click on "Update Graph"

s = name();
close1 = GetSeries(s, close);
open1 = GetSeries(s, open);
high1 = GetSeries(s, high);
low1 = GetSeries(s, low);
PlotCandleStick1(open1, high1, low1, close1, s, colorBlack, StyleSymbolNone);
PrintChart('Symbol: '.s, '', BottomLeft, colorRed, colorTransparent, colorTransparent, 250);


To create a line that shows whether there is a difference in OHLC prices, type the following formula:

s = name();
close1 = GetSeries(s, close);
open1 = GetSeries(s, open);
high1 = GetSeries(s, high);
low1 = GetSeries(s, low);
diff = iff(close1 != close or open1 != open or high1 != high or low1 != low, 1, 0);
plot(diff, "Diff");


Charting, Backtesting and Trading using Fundamental Data

$
0
0
Want to chart and trade based on fundamental ratios and measures?

Sure you can do that with QuantShare. As you may know QuantShare is a powerful analysis tool where you can do anything from displaying, analyzing, ranking, comparing� any kind of data. But you may also know that QuantShare doesn�t provide data. Hopefully, we have several downloaders that you can use in our sharing server. One of these downloaders lets you retrieve historical data of several fundamental measures from Morningstar.


Getting Historical Fundamental Data

I will show you how to get yearly fundamental data by using the following item: 1181.
This item gets 10 years of yearly data for 80 fundamental items/ratios.

- Open the follow URL: 1181
- Click on "Download" then follow instructions to get the downloader
- In QuantShare, select "Download -> Download Manager"
- Select "Morningstar Historical Fundamentals"
- Click on "Open Selected Downloader"
- You can choose for which stocks you would like to download fundamental data by adding conditions in the "Symbols" tab
- Click on "Start Downloading"

In this process, QuantShare will get fundamental data from different URLs generated by the downloader. It will parse the data and insert it in a custom database.


Checking Fundamental Data

Let us look at the fundamental data we have just downloaded.

- Select "Data" then "Edit Databases"
- Next to "Choose Database", select "Custom"
- Next to "Choose a custom database", select "morningstar_fundamentals"
- Select a symbol in "Symbols" panel to see fundamental data in the right panel

Note that " morningstar_fundamentals" is the database created by our downloader.


Charting fundamental data

What if we want to display changes of revenues on a chart?

Here is how to do that:
- Open a new chart
- Right click on it then select "Create new pane"


There are two ways to add the revenues on this pane. You can either use the wizard or type the formula directly for that pane.

Solution 1:
- Click on the first icon located in the top/left corner of the pane
- Select "Databases/Fields"
- Select "morningstar_fundamentals" database then "revenue_usd_mil" field
- Click on "OK"

Solution 2:
- Right click on the pane then select "Edit Formula"
- Type the following formula then click on "Update Graph"

a = GetData('morningstar_fundamentals', 'revenue_usd_mil', LastData);
Plot(a, "Revenues", colorBlack, chartLine, StyleSymbolNone);


The "GetData" function allows you to retrieve data from a custom database. "LastData" option instructs QuantShare to use the last available value if no value is available for the current bar/date.
"Plot" instructs QuantShare to plot a variable on the chart.

Example of a chart plotting ROA (Return on asset):


Backtesting a Fundamental-based Trading System

Let us create a trading system now.

- Select "Analysis -> Simulator"
- Click on "New" to create a trading system

Since you already know how to get fundamental data using QuantShare programming language, let us use the formula editor.

- Select "Create trading system using the formula editor"
- Type the following formula:

a = GetData('morningstar_fundamentals', 'gross_margin_pct');
buy = a > 50;
sell = a < 50;


// This simple trading system enters long when a stock�s gross margin (percentage) is higher than 50. It exits the position when the gross margin of the stock becomes lower than 50%.

To backtest your trading system, select it in the Simulator Manager then click on "Simulate / Backtest" button.

Note: You can automatically get the available databases and fields in your account by using the CONTROL+SPACE shortcut.

Example:

After you type a = GetData(", use CONTROL+SPACE to get available databases.
After you type a = GetData('morningstar_fundamentals', use CONTROL+SPACE to get available fields in your fundamentals database.


Here are some more articles that may interest you:

How to Download and Use Fundamental Data
How to Quickly Create Fundamental Scans
Fundamental Stock Analysis: Rank stocks based on a valuation ratio
Fundamental Screen based on Stock price, ROI and Market capitalization
3 Market Indicators based on Fundamental Data

Presentation of QuantShare's new Real Time Version

$
0
0
QuantShare new real time version is finally here. In this post, we will briefly describe what's new in this version and the different real time tools available in QuantShare trading software.


Created using the Grid Tool


How to Connect to a Data Feed

Here are the different data feeds that are currently supported by QuantShare:

Interactive Brokers
IQFeed
Barchart
Delayed Yahoo
Free Forex

More data feeds will be added later.


The first thing you should know is that QuantShare allows you to connect to several data feeds at the same time. If you are using IB as a broker and have a subscription to IQFeed then you can get real time data from both IB and IQFeed services at the same time.

To connect to a data feed, select "Accounts -> Connect" then select the data feed you want to connect to QuantShare.

Once done, the "Connection Settings" control will appear. There you can define the settings of your data feed.
Options under "Provider Settings" tab are particularly important for some data feeds. There you can usually specify how to connect to the data feed (Example: Username, password...).


Real Time Settings

Each data feed has its own settings.

To open the settings control of your data feed, click on ".. Data Feed(s)" button at the bottom of QuantShare then click on "Settings" button next to your data feed.

The most important settings are:

Base Time-frame (Common Settings): Defines the default time frame for the data feed. This time frame will be used for example when requesting historical data. The backfill request will instruct the data feed to send historical data in the base time frame. Also, your real-time data will be saved locally in the base time frame.

Load data from local database (Common Settings): Tells QuantShare whether you want to load data from the local database when requesting real time data

Save data to local database (Common Settings): Tells QuantShare whether you want to save data to the local database when closing a real time connection.

Default backfill duration in minutes (Backfill Settings): Defines the number of minutes worth of data to backfill. Note that some data feeds have limitations and thus even if you put a very high value here, you will only get part of the data.


General real time and intraday settings can be updated by selecting "Accounts -> Real time Settings" or "Accounts -> Intraday Settings".

For more information, please check QuantShare documentation.


How to Get Real Time Charts

Create a new chart or select an existing one then select an intraday time frame at the bottom of the chart (left).
Right click on the chart, select "Data Source" then a data feed.

Now, you should be able to get real time quotes for the selected security.
Note that the circle located at the bottom/right corner of the chart turns green when the connection with the data feed is established and yellow if the connection is broken/lost.

To perform a backfill (get historical data), click on the circle (bottom/right corner), then click on "Backfill".
On the same menu, you can get time & sales data by selecting "Trading Tools" then "Time & Sales".

Note: To disable real time streaming, right click on the chart, select "Data Source" then "No Data Source".


How to Create a Real Time Watchlist

To create a real time watchlist, you must create a dynamic watchlist first. Here is how to do that: http://www.quantshare.com/how-438-how-to-create-a-watchlist

In the "Dynamic Watchlist" control (you can display it after you create or update a dynamic watchlist) and in the second screen, select an intraday time frame under "Period" panel.
Check real time option then choose a data feed. The "Analyze on each incoming tick" instructs QuantShare to analyze each symbol for each incoming tick (instead of at the end of the interval. Example: Each minute for a one-minute time frame).

For more information, please check QuantShare documentation.


Other Real Time Tools

QuantShare has several real time tools. Here is the list:

Time & Sales (We already saw that) :

Display real-time time & sales data for a specific security.

Market Depth:

Display market depth or L2 data for a specific security. Your data feed must support that and you must have the appropriate subscription.

Alerts Tool (Tools -> Alerts Manager) :

Create real-time alerts for one or several securities. There are six different ways to be notified when the alert is triggered.
This tool allows you also to create alerts based on drawing data. Right click on the drawing item then select "Create Alert".

Grid Tool (Tools -> Grid) :

This tool looks like excel. You can use it to create spreadsheets in real time mode.
This is a very powerful tool.

Automated Trading (Simulated mode only for now) (Portfolio -> Portfolio) :

Create automated trading strategies (ATS) by creating a portfolio then associating it with a trading system.
Your ATS can be based on a simple trading system or an advanced one with multiple money management scripts.

Note that currently you can run ATS only in simulated mode (No live trading yet).


Update Chart Layout based on Active Time Frame

$
0
0
A very interesting blog post we have written few weeks ago shows how to associate a specific layout to a security or a group of securities. The idea is very interesting particularly if you are trading several assets at the same time. With this technique you can for example automatically display different indicators to each group of assets.
More information about this script can be found here:
Update chart layout based on active symbol Part 1 - Part 2

Today, we will do the same thing but instead of associating a layout to a security, we will associate a layout to a specific time frame.


How to create a layout

A layout contains all the required information to display a chart. It contains the number of panes, the template of each pane, the different formulas for each pane�

To create a new layout from an existing chart, right click on the chart, select "Layout" then "Save Layout As".


How the Script Works?

The script basically loops indefinitely checking for a change in the time frame of the active chart. Once the time frame of a chart changes, it checks if there is a specific layout associated with the new time frame. If it founds one, it automatically updates the active chart with the new layout.

You can download the script here

For more information about how to install the script and add it to the bookmark panel (button installed on the main window), please read the "How to Install the Script" section here.


Testing the Script: Update Layout based on the Time Frame

In order to associate a layout to a time frame, you must open the script and update the C# code. Don't worry it is very easy.

In the first line, you can specify the default layout to apply to any chart (white the script is running).

Example: string defaultLayout = "Default";

In this example, the default layout name is "Default".

In next lines, you can associate a time frame to a particular layout. Each time that time frame is selected on a chart; the corresponding layout is automatically loaded.

Specify a positive time frame value to reference EOD periods and a negative time frame value to reference intraday periods.

Examples:

// Associates the daily time frame with the "DailyL" layout
AddPeriod(1, "DailyL");

// Associates the one-hour time frame with the "Swing" layout
AddPeriod(-3600, "Swing");

// Associates the tick time frame with the "BidAsk" layout
AddPeriod(0, "BidAsk");

Note that the different layout names mentioned in the above examples are not built-in, they are just examples.


Backtesting Your Trading Systems: Symbol Segmentation

$
0
0
Say you have a trading system and you want to see how it performs for different set of symbols. Of course, you can have the trading system backtested for each different sector or industry like it is shown in this post. But you can also define your own segments and have the trading system backtested for each of your segments, so that you can easily and quickly determine for which segment your trading system performs best.


Example of Segments

Here are some examples of segments you can use:

- Stocks
- ETFs
- Futures
- Forex
- Stocks with ROI > 10
- S&P 500 Stocks
- Stocks in the Gold industry
...


Create the Trading System

For this post, we will create a very simple trading system. Buy when the price crosses above the 50-bar moving average and sell when it crosses below the same moving average.

Here is how to create a trading system: Create a trading system

And here is the formula that you should type to implement this trading strategy:

buy = cross(close, sma(50));
sell = cross(sma(50), close);


// close: Price of the analyzed security
// sma: Function that creates a simple moving average
// cross: Function that detects when a time-series crossed above/below another time-series


Create the Segmentation Function

Select "Tools -> Create Functions" to create a custom function using C#.

If you are not a programmer or just don't want to learn how to use C# programming language, you can skip this paragraph and download the function directly from here: 1369.

After you open the functions editor, click on "Add" to create a new function then type a name ("Segment") for this indicator.
Create two parameters: segments (string) and index (number)

In the editor, type the following formula:

string[] seg = segments[0].Split(';');
if(index[0] < 0)
{
result.Assign(seg.Length);
}
else
{
int i = (int)index[0];
QSFormula formula = cFunctions.CompileFormula("a=" + seg[i] + ";");
result = formula.GetVectorDouble("a");
}


Explanation:

- The formula gets two parameters:
Segments: Defines segment formulas separated by semi-colons. Example: rsi(14)>70;close>sma(30)
Index: Defines the segment index to use. Set a negative value to get the number of segments

- The script separates segments and stores them in an array (seg).
- It then checks the value of "index"
- If it is negative then it returns the number of segments
- If it is positive then it gets the segment referenced by this index and compiles the formula behind that segment
- Finally, the result of that formula is returned by the function (result = �)

Once compiled and saved, you can use this function in the QuantShare programming language by typing for example:

a = Segment("rsi(14)>70;close>sma(30)", 1);

// This will calculate and return the result of "close>sma(30)". It is equivalent to:
// a = close>sma(30);


Updating Your Trading System

Let us update our previous trading system and include the "Segment" function we have just created. The idea is to create multiple segments then use an optimizable variable to calculate a different segment formula each time the simulation is run.

Example of segments:

Stocks:
stringcontains(group(), 'stock')

S&P 500 Stocks:
stringcontains(index(), 's+p 500')

Medial Industry Stocks:
stringcontains(industry(), 'medical')

Stocks listed on NASDAQ:
stringcontains(market(), 'nasd')

Stocks listed on NYSE:
stringcontains(market(), 'nyse')

Stocks that hit a monthly high during the last 25 trading days:
hhv(high == hhv(high, 25), 25)


Formula:

buy = cross(close, sma(50));
sell = cross(sma(50), close);

seg1 = "stringcontains(group(), 'stock');stringcontains(index(), 's+p 500');stringcontains(industry(), 'medical');stringcontains(market(), 'nasd');stringcontains(market(), 'nyse');hhv(high == hhv(high, 25), 25)";

nb = Segment(seg1, -1);
Optimize("a", 0, nb, 1);
buy = buy and Segment(seg1, a);


Save the new trading system then in the simulator manager click on "Optimize" to backtest your strategy each time using a different segment.

Export Trading Orders from a Portfolio to a File

$
0
0
After generating orders from a trading system, the next step is usually to execute these orders in your broker platform.

Some brokers allow you to bulk import trades and thus the ability to export orders generated by the portfolio tool of QuantShare can save you huge amount of time. Of course, exporting orders can be useful in several other ways too.


Run a Portfolio Programmatically

- Select "Tools" then "Script Editor"
- Create a new script by selecting "File" then "New"
- To run a portfolio called "MyPorfolio", type the following script then click on "Execute" button at the top:

Portfolio.Run("MyPorfolio");


Export Portfolio's Orders Programmatically

Now, we want to get orders generated by this portfolio, add them to a file then save the file on your computer so that you can use it for example to bulk import trades in your broker platform.

Here is the script to do this:

string portfolioName = "test";
PortfolioTask task = Portfolio.Run(portfolioName);
// Wait until new signals are generated from the portfolio
while(!task.IsCompleted)
{
App.Main.Sleep(1000);
}

// Get portfolio
QPortfolio portfolio = Portfolio.GetPortfolio(portfolioName);
// Get pending orders
Order[] orders = portfolio.GetOrders();

// Create csv file
System.Text.StringBuilder text = new System.Text.StringBuilder("");
for(int i=0;i {
Order order = orders[i];
text.AppendLine(order.Symbol + ";" + order.Shares);
// Remove "//" if you want to submit orders in QuantShare programmatically
//order.SubmitOrder();
}

// Save the file under "c:\temp", update this directory or make sure it exists
System.IO.File.WriteAllText("c:\\temp\\" + portfolioName + "_orders.txt", text.ToString());


In the above script, each line added to the csv file is created using the "text.AppendLine" instruction. As you can see the format is here: Symbol;NbShares
Of course, you can update the format of your csv file to match your broker format.

You can for example, add whether to enter or exit a position by creating a new "type" variable:

string type = "Exit";
if(order.OrderOrigin == "Buy" || order.OrderOrigin == "Short")
{
type = "Enter";
}
text.AppendLine(order.Symbol + ";" + order.Shares + ";" + type);

// OrderOrigin contains one of the following values: Buy, Sell, Short, Cover or Stop.


The same idea of exporting trades/orders is also available in the following post:
Running QuantShare on Amazon's EC2 Cloud & Automate Strategies Signals


Exporting Orders for Several Portfolios At Once

You can repeat the process for several portfolios by adding few lines of code.
The new script will contain a list that you fill with portfolio names.The script loops through each portfolio in the list and executes the previous code.

Code:

ArrayList list = new ArrayList();
list.Add("portfolio1");
for(int i=0;i {
string portfolioName = list[i].ToString();
/// Here you must copy the script we used above to export trades (just remove the first line);
}


Bookmark Panel

Finally, it would be much easier if you add a button that executes that script in the bookmark panel. You will no longer need to open the script editor to execute the script. Just click on a button under QuantShare menus and you are done.

In the script editor, click on "Settings -> Add current script to bookmark panel"

Don�t know what the bookmark panel is?
Please read this.

Custom Shortcuts - Move a Chart to Display the Last Quotes/Data

$
0
0
In our previous version of QuantShare, we have released a new feature that lets you create custom shortcuts. The idea is to associate a specific shortcut with a QuantShare script. Since scripts can do almost anything on QuantShare, you can define a shortcut to perform any imaginable task.


How to Move a Chart to Show the Last Quotes?

This can be accomplished using the script editor of QuantShare.

- Select "Tools" then "Script Editor"
- Select "File" then add a new script. Name it "LastQuotes".
- Type the following formula to reference the selected chart then moving the scroll bar to show the last quote.

Charts.GetSelectedChart().ScrollBarIndex = 100000000;

- Once done, save the script and click on "Execute" to see how the scroll bar is moved on the selected chart. For this to work, make sure that the last bar is currently not shown on the selected chart.


How to Create a Custom Shortcut?

At the bottom of QuantShare, click on "Divers" button then "List of Shortcuts".

This form displays built-in and custom shortcuts.

For example, a built-in shortcut would be the "CONTROL+ALT+L" to switch between chart layouts.

To create a new custom shortcut, click on the "Add Shortcut" at the bottom.

Fill the following fields:

Name: The name of the shortcut. Example: LastQuotes.
Description: A description that tells you what the shortcut does.

Activation: Specify how to activate the shortcut. Example: check "CONTROL" and type "L" next to "Key".
Path: Specify the script to execute when the shortcut is activated.
Example: Scripts\LastQuotes.azf

This is the location of the script we have created previously. Remember I told you to name it "LastQuotes".

Click on "Save" to save your shortcut.

Note that in order to update a shortcut, you just need to create a new shortcut with the same name.


Testing The Shortcut

Now, let us test our new shortcut on a chart.

Select a chart then move the bottom scroll bar so that it doesn't show the last bar.
Guess what happens when you click on "CONTROL+L"?


Show Last Bar For All Charts

Let us imagine you want to display the last bar not only for the selected chart but for all charts.

Just keep the same shortcut, open your "LastQuotes" script then update its formula to:

Chart[] charts = Charts.GetAllCharts();
for(int i=0;i < charts.Length;i++)
{
charts[i].ScrollBarIndex = 100000000;
}


Real Time Alerts: Support and Resistance Lines Breakout

$
0
0
Let us say you want have a real time chart and you want to detect support or/and resistance breakouts.

You can draw resistance and support lines on a chart using the "Line" drawing tool or you can use the "Auto Support/Resistance" tool to let QuantShare draw for you the perfect support and resistance lines.

Breakout detection is very easy. All you have to do, is right click on a line, select "Create Alert" then choose "Above Upper Line" if you selected a resistance or "Below Lower Line" if you selected a support (This works only in the real time version).
This will automatically create an alert for you filled with the chart symbol, time frame, data feed and the correct condition.

The condition looks like this:

close > DrawItem('144895', 'Upper Line')

The "DrawItem" function is part of QS programming language and it returns the data of a drawing item. In this case the drawing item type is "Upper Line" and its name is "144895".
You can update a drawing item name by right clicking on it, selecting "Settings" then updating the "Name" field.

Note that the "DrawItem" function or the above condition can be used in any other QuantShare tool. As an example, you can plot this on a chart; use it in a screener, watchlist, automated trading strategy...


Alert Notifications

Back to the "Alert Settings" control; in "Notification" tab, you can select how you would like to be notified when the condition occurs.

You have many choices there including a chart message, a sound playing, an email message or a script to execute.


Alert Log

The "Alert Log" tab let you define a custom log message and color to be used by the "Alert Log" tool (See "Log" button at the top of the "Alerts Manager" tool).

Each time an alert is triggered, the trigger date, symbol and log message can be displayed in the "Log" tool. This tool is very interesting particularly if you associate many alerts with it or if you have an alert that is linked to several symbols.

Click on "Add Alert" then type a name for your alert.

Here is an example of an Alert Log window:


Alert Trigger

You know when an alert is triggered when the icon next to the alert name turns green (of course you will also receive a notification if want to).

If a stock breaks the support or resistance used by your alert then the alert icon will turn green. Note that you can still use that alert by moving the support or resistance line and this will automatically reset the alert.


Same Alert for several securities

Instead of creating an alert for each security you want to track. You can give the same name to all supports (support of each chart) and another name to all resistances. We already showed you previously how to change the name of a study or drawing item.

After this, simply create an alert like we did at the beginning of this article, but this time, just update the "Symbols" field to include all securities or stocks you want to track. You can add several symbols by separating them with semi-colons or by clicking on the "Add Symbols" button and then using the symbols selection tool.

Viewing all 106 articles
Browse latest View live