Quantcast
Channel: QuantShare
Viewing all 106 articles
Browse latest View live

Backtesting All Candlestick Patterns in 10 Minutes

$
0
0
Do you know if the Doji, Hammer, Harami and other candlestick patterns are profitable or not?
Stop guessing and start using QuantShare's rules analyzer and backtester tools.


Creating Hundreds of Candlestick Rules

- Select "Analysis" then "Rules Manager"
- Click on "Create" to create a new list of rules
- Call it "Patterns" then click on "OK"
- Select "Patterns" list then click on "Mass rules" at the top
- Click on "Add from TimesSeries Builder"
- Check "Include CandleStick Patterns" and uncheck other items
- Click on "Next"
- Click on "Select All" at the button then on "Finish"
- In the right panel (Masks), remove any existing mask
- Type "mask > 0" then click on "Create"
- Type "mask < 0" then click on "Create"

"mask" variable will be replaced by candlestick rules.
The first mask detects bullish candlesticks while the second one detects bearish candlesticks.

- Click on "Create Rules" at the bottom

You should now have about 244 rules


Analyzing the Performance of Each Candlestick

- Select "Patterns" list of rules
- Click on "Analyze the list"
- In the "Symbols & Period" tab, select the analysis start/end period and the symbols you want to backtest

For example you can add an "Index" condition with "S+P 500" as value

- Select "Output" tab then click on "Select Outputs/Exit Rules"
- Uncheck any existing item, select "Performance, use N-Bars Stop" then check "Buy then sell after 1 bar" (Update the "Number of bars" field if necessary)
- You can also backtest a short system at the same time, by clicking on "Add" then updating "Number of bars" to one and "Type" to "Short"
- Click on "OK"
- Click on "Continue" to start the analysis

Now, each candlestick rule will be backtested using a simple logic:

- Buy/Short when candlestick pattern is detected then exit the position after one bar
- Entries and exists will be based on the open of the next bar

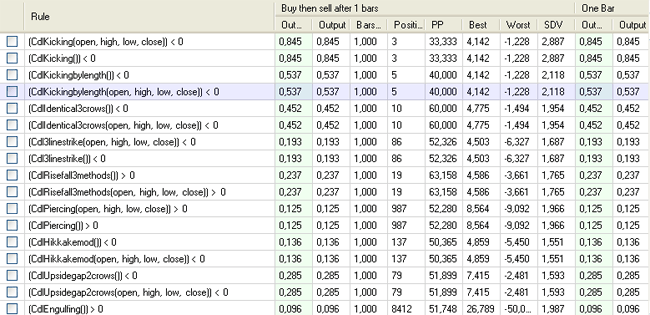
The analyzer report will display the average output (average performance), number of positions taken, percent of positive positions... for each candlestick rule and for each output/exit rule.


How to Exit At the Close of the Entry Bar

If you prefer to backtest rules by entering long the next bar at open and exiting the same bar at close then follow the next steps:

- Select your list of rules then click on "Analyze the list"
- Select "Outputs" tab then click on "Select Outputs/Exit Rules"
- Select "Custom Output", click on "Add" then on "Edit"
- Type "((CLOSE / OPEN) - 1) * 100" next to "SET" and "1" next to "WHERE"


True Portfolio Backtesting

The true portfolio backtester works differently from the rules analyzer tool. While the rules analyzer takes into account all positions and calculates metrics by averaging measures taken from each position, the true-portfolio backtester enters and exits positions like you would do in the real world.

Real-life constraints such as cash, number of positions and other measures are taken into account, which means that if the portfolio has no cash left then no positions will be bought and if there are 50 positions to buy on a specific day and you are allowing only 3 then only 3 positions will be bought.

Given these differences, backtester results may be very different from the rules analyzer results.

If you want to use the true portfolio backtester to analyze each trading rule, you can create a new trading system, use the following formula then optimize the strategy.

nb = ApplyRule("", "Patterns", -1);
Optimize("a", 0, nb-1, 1);
buy = ApplyRule("", "Patterns", a);
SetSimTiming(_Sell, _Close, -1);
SetSimStop(_StopNBar, _Point, 1, 0);


More info about backtesting and optimization can be found here:
True portfolio simulation applied to trading systems
Optimization of a trading system
Troubleshooting a Trading System

$
0
0
If your trading system doesn't generate any trade or behaves in an unexpected way, the following article will help you troubleshoot, debug and fix it.

A trading system is composed of:
- Formula
- Settings
- Ranking Systems
- Money Management Scripts (Although we call it money management script, it is actually much more than that. These scripts allow you take full control of your trading system, create adaptive strategies, metrics, dynamic position sizing�)


Step 1

If your trading system contains a money management script then the first step is to remove it (you can save it and add it later). Once done, backtest your trading system and check if the issue is fixed.

Fixed: You must probably debug the money management script now (go to the last paragraph of this article).
Not Fixed: Move to step 2.


Step 2

Check your symbols and the time frame used by the trading system. Make sure you have data for some of these symbols in the chosen time frame.
If your trading system trades S&P 500 stocks using a one-minute period then make sure you have downloaded intraday data for these S&P 500 stocks. You can check that by displaying a chart of one of these stocks using one-minute time frame.

Not Fixed: Move to step 3.


Step 3


Now, it is time to check the backtesting period (Symbols & Dates tab).
You must have quotes for the selected securities within the start and end date specified at the bottom of the control.
To make sure all data is analyzed, set for example "1900" as year for the start date and "3000" as year for the end date.

Not Fixed: Move to step 4


Step 4

Let us check the formula now.
First of all, make sure the variables "buy and sell (optional)" are initialized (long system) and "short and cover (optional) are initialized too (in the case of a short system).

For example:
filter = close > 10;

The above trading system will not generate any single trade because QuantShare will not be able to find the "buy" variable.

Instead, you should type:
buy = close > 10;
OR
filter = close > 10;
buy = filter;


If you have a trading system with several lines, the best way to troubleshoot your system is by removing a rule, performing a backtest then repeating the process again until you discover the part of code that generates the issue or the unexpected behavior.

Example:
buy = close > 10 and volume < 0;

By performing the above steps, you will easily discover that the issue is caused by the following part (volume < 0). This is because volume is never negative. To get a visual confirmation, you can select a chart, create a new pane, right click, select "Edit Formula", plot the above rule then click on "Update Graph".

Here is the formula to plot the volume time series:
a = volume < 0;
plot(a, "Test", colorRed);


On the chart, you will see that the value of variable "a" is always equal to 0.

If you get no signals after performing a backtest, then you can plot the "buy" rule on a chart (using the "plot" function described above) and see if the "buy" variable is always equal to 0 (false - no signal) or not.You can also check each rule individually to see which one is the most restrictive (prevents the system from generating signals).

Another thing to check is the system type. If you select "Short" as system type and type:
buy = close < sma(20);

Then it is clear that no signals will be generated since you want to trade a "Short" only system and you didn't specify a "short" rule in your formula.

Not Fixed: Move to step 5


Step 5

The issue could be cause because of some changes you have done in the settings.
In this case, copy your formula, create a new empty trading system, paste your formula, select symbols/period/dates then backtest.

Still Not Fixed: Send us your formula to support [at] quantshare [dot] com and we will tell you what is wrong :)


Debugging a Money Management Script

If you find that the issue is caused by your money management script then the best way to fix this is by removing the code of one event, backtesting the strategy then checking for the issue.
If the issue is still present, remove the code of another event then backtest again, until you discover which part of the code to analyze further.

After that, remove some part of the code within the event (make sure the script can still be compiled), backtest then repeat the same steps until you find out what is causing the issue.

Do not forget to save your script before performing changes.

You may also want to use the following functions to trace information during the script execution:

Divers.Output("Type info here");
// This function displays trace info in the "Details" tab of the trading system report. The trace info is stored separately for each trading day.

Global.Trace("Type info here");
// This functions displays trace info in "View -> Output"


Example of a code that can generate an error during execution:

OnStartSimulation:
Functions.SetNumericInput("My Input", 0, "");

OnEndPeriod:
int val = (int)Global.GetVariable("My Input");

By following the above steps, you will easily discover that the issue is caused by this line:
int val = (int)Global.GetVariable("My Input");

In this case, there was a casting error. Numeric input variables are of type (double), so you should change this line and type:
double val = (double)Global.GetVariable("My Input");


Please tell us about your experience in the comments section.

Reading and Exporting Data from QuantShare to Excel Programmatically

$
0
0
Want to use Excel with QuantShare? Getting data from Excel to QuantShare and exporting data from QuantShare to Excel?

In this post, I will show you how to do that using QuantShare scripts and also give you some examples to get you started.


Excel COM Automation

First of all, before the example, we must add some lines of code to scripts that are going to automate Excel.

The code can be found here: Excel COM Functions

You just have to add it at the bottom after your own code.
In the examples, we will reference this code by the following tag ([excelcode]). When you find this tag, just replace it by the above code.

You must also add a reference to excel DLL in each script.
To do this:
- click on "Menu" button at the bottom of the script editor
- Select "Add references"
- Click on "Add Reference"
- Select "Microsoft.Office.Interop.Excel.dll" from the QuantShare folder


Exporting Strategy's Equity Line

Create a new money management script from "Analysis -> Advanced Money Management" then type the following code.

Global Event: (Add reference to "Microsoft.Office.Interop.Excel.dll")

List equity = new List();
[excelcode]


OnEndPeriod Event:

equity.Add(Portfolio.Equity);

OnEndSimulation Event:

Excel.Worksheet sheet = CreateExcel();
string[] data = new string[equity.Count + 1];
data[0] = "Equity";
for(int i=0;i < equity.Count;i++)
{
data[i + 1] = equity[i].ToString();
}
FillExcel(sheet, 1, data);


- Save the money management script then add it to your trading system
- Each time you backtest this trading system, an excel document is automatically opened and filled with equity data.

This money management script is already available in the sharing server. You can download it directly from here: 1406


Exporting Data of Selected Chart

- Create a global script using "Tools -> Script Editor"
- Type the following code then add it to the bookmark panel by select "Settings -> Add Current Script to Bookmark Panel"

Excel.Worksheet sheet = CreateExcel();
Chart chart = Charts.GetSelectedChart();
if(chart != null)
{
sheet.Cells.ClearContents();
double[] close = chart.ChartData.GetTimeSeries("close");
int count = close.Length;
string[,] data = new string[count, 2];
for(int i=0;i < count;i++)
{
data[i, 0] = chart.ChartData.IndexToDate(i).ToString();
data[i, 1] = close[i].ToString();
}


FillExcel(sheet, data);
}

[excelcode]


- To export date/close data to an excel file, simply select a chart and double click on the script (in the bookmark panel)


Reading Data from Excel

- Create a global script using "Tools -> Script Editor" then use the following script:

Excel.Worksheet sheet = OpenExcel("filename");
while(true)
{
Point symbol = new Point(1, 1);
Point value = new Point(1, 2);
string symbol1 = ((Excel.Range)sheet.Cells[symbol.X, symbol.Y]).Text.ToString();
string value1 = ((Excel.Range)sheet.Cells[value.X, value.Y]).Text.ToString();
double value2;
if(Double.TryParse(value1, out value2))
{
Global.Trace(symbol1 + " - " + value2);
}
App.Main.Sleep(1000);
}

[excelcode]


This script simply reads the first and second cell of an excel file and adds the data in the output (View -> Output). The data is read once a minute.
Don�t forget to replace "filename" by your excel file location.


If you want to contribute to this with new code and ideas please check the thread created by our friend Alexander:
An example for Excel COM automation - Further joint development?

How to Run QuantShare without UAC Prompts?

$
0
0
Want to avoid UAC prompts when starting QuantShare?

Our friend Dave W. recently sent us instructions on how to simplify the process of avoiding UAC prompts.

The following files should make the process of avoiding UAC prompts easier.
http://www.quantshare.com/free/QuantShare_WO_UAC_Prompt.rar

After downloading and unzipping the above file -- a task scheduler XML file and a shortcut file (.lnk) -- all the user has to do is open the Windows task scheduler (type 'task' in the Windows 7 start menu), select the Import Task feature on the right side of the screen, and then import the XML file. The imported XML task allows the user to run the 64bit version of QuantShare with elevated privileges.

After clicking OK to save the imported task, the shortcut in the .zip file should launch the 64-bit version of QuantShare without a UAC prompt.

This assumes that QuantShare is installed on the following directory:
C:\Program Files\CTrading\QuantShare\

If this is not the case or if you want to avoid UAC prompts for the 32-bit version, open "RunQuantShare64_UAC.xml" file then update the "command" tag by replacing the path to QuantShare executable file ("QuantShare64" for the 64-bit version and "QuantShare" for the 32-bit version).

Here is how it works:
- The shortcut runs the "RunQuantShare64_UAC" task we have just created
- The task starts QuantShare
- Task has the "HighestAvailable" as runlevel value and thus can run without UAC prompts

How to Optimize a Trading System with Thousands of Billions of Combinations

$
0
0
You can use it to optimize your list of rules, your ranking systems, your neural network models and even your trading systems. It is called AI Optimizer and we recently improved it so that it can handle thousands of billions of combinations easily and quickly.

Let me walk you through the AI optimizer with a simple trading system example.

- Select "AI" then "Optimize"
- In "Optimize" form, click on "Create"
- Select the optimization method or algorithm to use (PBIL or Genetic Algorithm)

Note here that PBIL has the enormous advantage of supporting multithreading and thus can run much faster.

- We will select PBIL in this article
- Select "Trading System" under "What do you want to optimize?"
- Click on "Next"
- Fill PBIL settings

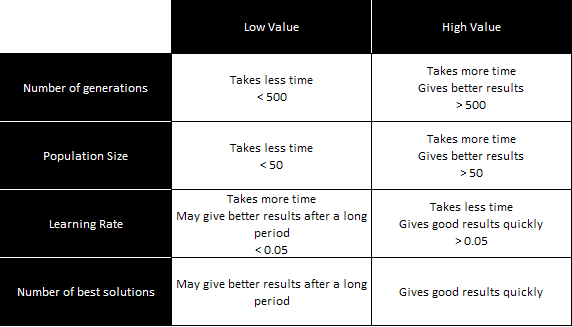
Number of generations: Each generation has a specific number of members (population). Each member represents a trading system. After the members of a generation are backtested, only the best ones + random ones are passed to the next generation.
Population size: This is the number of members in a generation.
Learning rate: Specifies the percentage of knowledge that is passed to the next generation
Number of best solutions to use in learning: The number of best performing members to be used in the learning process
Enable multithreading: Check this to enable multithreading (several trading systems will be backtested at the same time, the number of simultaneous trading system depends on the number of CPU cores you have in your computer)

Take a look at this table and how each setting influences our optimization research:


For more info regarding the PBIL and the Genetic Algorithm, please check these links:
http://en.wikipedia.org/wiki/Population-based_incremental_learning
http://en.wikipedia.org/wiki/Genetic_algorithm


- Click on "Next"
- Click on "Using optimize variables in a formula" radio box
- Click on "Update Trading System"
- Type the following formula in the formula editor:

Optimize("a", 10, 100, 10);
Optimize("b", 10, 100, 10);
Optimize("c", 2, 22, 5);
Optimize("d", 10, 90, 10);
Optimize("e", 1, 5, 1);
Optimize("f", 0, 5, 1);
Optimize("g", 5, 40, 5);

Optimize("s1", 10, 100, 10);
Optimize("s2", 10, 100, 10);
Optimize("s3", 10, 400, 20);

Optimize("m", 1, 20, 2);

SetSimSetting(_NbPositions, m);

rule1 = sma(a) > sma(b);
rule2 = rsi(c) > d;
rule3 = close > e;
rule4 = volume > f * sma(volume, g);

buy = rule1 and rule2 and rule3 and rule4;
sell = !rule1 or !rule2;

SetSimStop(_StopLoss, _Percent, s1, 0);
SetSimStop(_StopProfit, _Percent, s2, 0);
SetSimStop(_StopNBar, _Percent, s3, 0);


The trading system works as follow:
- Buy when the security first moving average is above second moving average and relative strength index is higher than a specific threshold and close above a certain price and volume higher than N-Times the average volume.
- Sell if either the first or second rule is no longer valid
- Add 3 stops (Stop Loss, Profit Stop and N-Bar Stop)

As you can see in the formula, there are many optimizable variables.
The first ones ("a" to "g") are used to optimize different indicators "moving average, relative strength index...)
The second ones (s1, s2 and s3) are used to optimize stop thresholds
The last one is used to optimize the maximum number of positions allowed in the portfolio. That value varies from 1 to 20 and is incremented by 2.
This means that you can get one the following number of positions: 1, 3, 5, 7, 9, 11, 13, 15, 17, 19


- Now, click on "Update Trading System" to save your strategy and get back to the AI optimizer (You have now created 21.6 billion optimizations)
- Type your fitness formula

The fitness formula is used to compare trading systems and to select the best ones. By default, the annual return is used as fitness.
But if you are looking for high Sharpe systems, you can use instead:

Fitness = SharpeRatio;

Here are some other examples:

Annual Return above 10% and lowest drawdown:
if(AnnualReturn > 10)
{
Fitness = MaximumSystemDrawdown;
}
else
{
Fitness = -100;
}


Sharpe Ratio and total number of trades above 100:
if(NumberOfTrades > 100)
{
Fitness = SharpeRatio;
}
else
{
Fitness = -100;
}


Percent winners:
Fitness = PercentOfWinners;


The fitness function is very powerful and it allows you to get exactly the kind of system you are looking for.

Another example would be to get trading systems that have the maximum number of positive monthly performance:
int count = 0;
for(int i=0;i < MonthlyReturn.Count;i++)
{
if(MonthlyReturn[i] > 0)
{
count++;
}
}
Fitness = count;


Note: The above formulas are C# based. Under the fitness formula editor, make sure you choose "C#" instead of "JScript".


- Click on "Next"
- Click on "Symbols & Dates" to specify the securities to include in the trading system, the simulation/backtesting start/end period and the period (time frame and EOD/Intraday)
- Click on "Define Notifications" to specify how you want to be notified when the optimization ends
- Click on "Next" to save your optimize item
- In the optimizer form, select the optimize item we have just created then click on "Run"

Note that there are two run options:
Run once: Run the optimizer once
Run indefinitely: This means that when the optimization ends, the optimizer will start again searching for more profitable systems


In-Sample/Out-of-Sample

It is very important to define in-sample and out-of-sample periods.
Basically, you should optimize your trading system using a specific period. Let us say that the period you are using in the optimizer spans from 2000 to 2010.
Once the optimization is completed, you should use the optimization report to backtest the best performing strategies using a different period (out-of-sample). That period for example could span from 2010 to 2014.
You can also backtest these strategies using different symbols to really assess the strength of each strategy.


NB: The system we have used in this post is simply an example. It is your turn now to create your trading systems and optimize them with the AI optimizer.

How Does QuantShare Work?

$
0
0
Note that this diagram displays only part of QuantShare features. But this should give you a clear idea of how QuantShare is organized.


[Object][Object][Object][Object][Object]
C# Scripts
(Advanced)
[Object]
[Object][Object][Object][Object][Object][Object][Object][Object][Object][Object]
C# Scripts
(Create custom drawing tools)
[Object]
[Object][Object]
C# Scripts
(Create advanced composites)
[Object]
[Object]
C# Scripts
(Create fitness functions)
[Object]
C# Scripts
(Create metrics)
[Object]
[Object]


How to Detect Potential Issues/Errors in Your Historical Data?

$
0
0
The script I am going to show in this post can be used detect potential data issues. It can be used to detect potential splits, bad ticks, issues in OHLC data...

The script simply uses a list of pre-defined rules that will be applied to all your securities. An example of rule would be to detect moves and report any security that moved more than X normalized ATRs.

Later, you can of course add your own rules to detect not only potential data issues but anything else you want.

This post was suggested by our friend Dave and here are the different rules that will be used:
- price moves of X normalized ATRs (potential split)
- low price greater than high price or open price (or high less than low or open)
- low / high price more than X normalized ATRs from the open

And here is the equivalent of these rules in QuantShare programming language:

rule = natr(1) > 8*natr(10);
rule = low > high or low > open or low > close;
rule = high < low or high < open or high < close;
rule = ((high/low)-1)*100 > 8*natr(10);


For more info about QS language, please read this blog post: QS Programming Language


How to Create a Global Script

In QuantShare, select "Tools -> Script Editor".
In the script editor, select "File -> New" then type a name to create a new script.
Scripts are C# or JScript.Net based.

You can download the script here: Potential Issues/Errors Script

Once added, you can add the script to the bookmark panel.

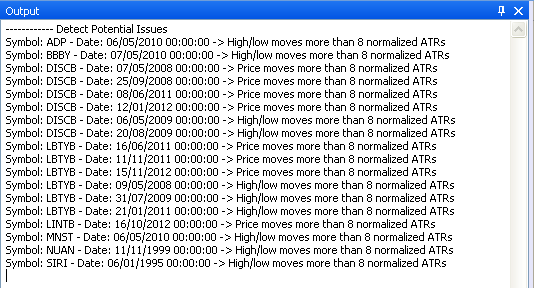
When executed, the script will report all issues in the output window (View -> Output). You can then check the issue directly in a chart, fix it manually (Data -> Edit Databases) or download data again for the concerned securities.


Example:


How to Update the Script?

There are five variables you can update in this script:

1/ The first two lines define the time frame and whether you would like to analyze end-of-day or intraday data.
Example:
timeframe = 1; // 1 day (or 1-second if intraday data)
isHistorical = true; // Analyze EOD data


2/ The variable "symbolsFilter" refers to a symbols filter. You can keep it empty to analyze all securities in your database or you can type a a symbols filter to analyze only specific securities.
You can create a symbol's filter by selecting "Symbol -> Symbol's View". Right click on the control then click on "Create a new symbols filter". After that you can add one or several conditions to your symbols filter to returns only the securities that meet these conditions.


3/ Filter rule variable allows you to filter stocks on specific bars.
For example, to consider only stocks whose price is higher than $1, simply type:
string filterRule = "close > 1";


4/ The variable "Rules" is a list that contains the different rules used by the script to detect potential data issues.

You can add a new rule, simply typing:
Rules.Add(new Rule("descriptive name", "formula in QS language"));


How to Backtest an Intraday Stock Trading System with EOD Ranking

$
0
0
In this article, I will show you how to mix end-of-day and intraday data by creating an intraday trading system that trades different stocks every day.

Let us say you want to implement the following intraday trading system:
- Enter long when a stock breaks the first 30-minute resistance

Besides the above rule, you want to trade stocks that performed best the previous day. Let us say that for each trading day, you want to pick from S&P 500 stocks, the first 20 stocks that had the best performance. You will then trade these stocks using the above intraday rule. Each day, you are going to perform the same process. But before trading or investing in such strategy, how can you backtest it?


Create the Intraday Trading System

Let us begin by creating the intraday trading system.
Click here to learn how to implement a trading system.

We must first create the function that calculates the 30-minute resistance. For this, let us use an indicator available on the sharing server (997).
After downloading it; select "Tools -> Create Functions" to see how this indicator was implemented.

This chart displays the high and low of the 30 first minutes of a trading session:


In QuantShare programming language we should write:

res30 = FirstMinutesHL(30);

The second step would be to implement the breakout; this is done using the "cross" function:

buy = cross(close, res30);


How to Rank Stocks

Ranking securities on fly is one of the most powerful features of QuantShare.
The "comp" function is capable of ranking and creating composites on fly in different tools such as the screener, simulator, portfolio�

More information about this function can be found in the documentation and in the following articles:
How to create market indicators using the composite function - Part 1, Part 2, Part 3.
New Ranking and Percentile Composite Functions
Trading Indicators using the Rank and Percentile functions


To rank stocks based on their daily performance, type:

a = comp(perf(close, 1), "rank");

To buy top 20 stocks with the highest performance, type:

buy = comp(perf(close, 1), "rank") <= 20;

The best stock has a rank of 1, the next one has a rank of 2 and so on�


Intraday Stock Trading System with EOD Ranking

Now, it is time to combine EOD and intraday rules. Since our strategy is based on intraday data, we can reference our EOD rank rule we implemented previously using the "TimeframeSet" function.

This function allows us to switch to a different time frame, performs calculation then returns back to the original time frame.

Here is the process:

- We start with intraday time frame
- We use "Timeframeset" function to switch to daily time frame
- We calculate one-bar return (The time series is automatically synchronized with the main time frame)
- We move back to the intraday time frame
- We rank stocks based on the one-bar return and get the 20 best performing ones
- We create the intraday rule (cross)
- We combine the ranking and the cross rules

Here is how to implement the formula:

// EOD
TimeframeSet(-1);
rule1 = perf(close, 1);
rule1 = timeframedecompress(rule1); // This function is used to decompress the time series and synchronize it with intraday data
TimeframeRestore();

dailyRule = comp(rule1, "rank") <= 20;

// Intraday
res30 = FirstMinutesHL(30);
inRule = cross(close, res30);

// Buy Rule
buy = inRule and dailyRule;

// Sell Rule
sell = day() != ref(day(), 1); // Exit the same day
SetSimTiming(_Sell, _Close, -1); // Sell at close of current bar (instead of open of next bar)


Before backtesting this strategy, make sure you already downloaded end-of-day and intraday one-minute data for the analyzed symbols.

A similar trading system is available for download in the sharing server. You can get it here:
1379


How to Calculate and Display the Bid/Ask Spread on a Chart

$
0
0
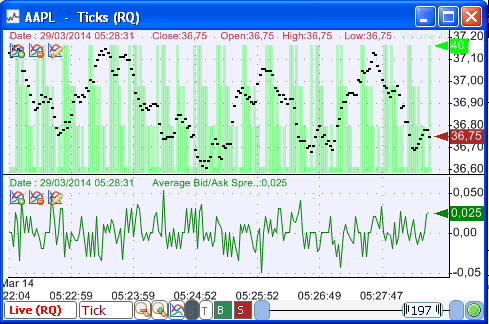
A new function introduced in version 3.0.1 of QuantShare allows you to create custom functions/indicators based on bid/ask data.
This function cannot be accessed directly from the QuantShare programming language but we can use it in the custom functions tool to create new functions (C# based) that can be referenced later by the QuantShare programming language.


Calculate the Average Bid/Ask Spread

The indicator we are going to implement now, calculates the average ask price for a specific bar then subtracts it to the average bid price for that same bar. If you are displaying a one-minute chart then the average ask/bid is calculated based on all ask/bid updates that occurred during that bar.

- Select "Tools -> Create Function"
- Click on "Add" then type "AvgBidAskSpread"

In the formula editor, type the following code:

// Get the bid vector (history) for the current symbol
VectorCustomDouble bid = cFunctions.GetBidAskData(cFunctions.Symbol, "bid");
// Get the bid vector (history) for the current symbol
VectorCustomDouble ask = cFunctions.GetBidAskData(cFunctions.Symbol, "ask");
// Check if we have bid/ask data the current symbol
if(bid.Length > 0 && ask.Length > 0)
{
   // Loop through each bar (we can also replace result.Length by ask.Length or bid.Length)
   for(int i=0;i<result.Length;i++)
   {
      // Initialize the average ask variable
      double avgAsk = 0;
      if(ask[i].Length > 0)
      {
         // Loop thought each ask update that occurred within the bar i
         for(int j=0;j<ask[i].Length;j++)
         {
            // Add the current ask to the average ask variable
            avgAsk += ask[i][j];
         }
         // Calculate the average by dividing the sum by the number of ask updates
         avgAsk = avgAsk / ask[i].Length;
      }
      else
      {
         // Set average ask to zero since there were no ask updates for bar i
         avgAsk = 0;
      }
      
      // Perform the same logic for bid
      double avgBid = 0;
      if(bid[i].Length > 0)
      {
         for(int j=0;j<bid[i].Length;j++)
         {
            avgBid += bid[i][j];
         }
         avgBid = avgBid / bid[i].Length;
      }
      else
      {
         avgBid = 0;
      }
      
      // Calculate spread and add it to result vector (this vector is returned by the function)
      result[i] = avgAsk- avgBid;
   }
}


NB:
- The description of each instruction is included in the code.
- Bid/Ask updates are loaded from memory. QuantShare currently stores in memory the last 1000 tick/bid/ask updates. This means that only the bid/ask updates that occurred during that period will be included in the calculation.
- This indicator is available in the sharing server: 1432


Plot the Bid/Ask Spread on a Chart

Let us plot the Bid/Ask spread on a chart now.

- Open a new chart
- Right click on it then select "Create New Pane"
- Right click on the new pane then select "Edit Formula"

Since the name of the custom function we created previously is "AvgBidAskSpread", we can reference it in QS programming language just by typing it. Example:

a = AvgBidAskSpread();
plot(a, "", colorGreen);


Speed Up Optimizations by Saving Ranking Data into a Custom Database

$
0
0
If you have an advanced ranking logic in your trading system and needs to do a lot of optimizations then you should probably take a look at this article. You will find here instructions on how to make optimization run faster, much faster in some cases.


How?

Simply by creating a custom database to store ranking data and using that database to retrieve ranks for each symbol.
Instead of recalculating ranking for each optimization (In case ranking formula doesn�t contain any optimizable variable), your formula will read ranking data from a custom database where you stored that same ranking data previously.


Why?

Because reading ready-to-use data from a database is faster (around 5 times) than creating composites and ranking securities on fly. The higher the number of securities used in ranking the faster this solution would be compared to ranking on fly.


How to store ranking data in a custom database?

To do this, we will have to create a custom script.

- Create a new script using (Tools -> Script Editor)
- Copy the content of the script located here: Click to Get Script
- Add one or several ranking formulas, update few variables
- Click on "Execute" to calculate ranking and store them in a custom database

Here is what you should update in the script:
"databaseName" variable: Gets the database name
"symbols" variable: Gets the symbols used in the ranking. In the parameter you can define a symbols filter (Symbol -> Symbols View)

To create a new ranking formula, simply type:
Formula.Create("field name", "[formula]", min, max, step);

The min, max and step variables are useful if you want to create several variations of the same formula.

Example:

Formula.Create("Perf", "Perf(close, [])", 10, 100, 20); // [] is replaced by the appropriate value

If you want to create a single variable (example: Performance over the last 50 bars)

Formula.Create("Perf", "Perf(close, 50)", 50, 50, 50);


How to display ranking data?

After you set up your formulas and execute the above script, QuantShare starts calculating ranking and saving them in your custom database.

Here is how to display that data:
- Select "Data" then "Edit Databases"
- Select "Custom" next to "Choose database"
- Select your custom database then select a symbol (that was part of the symbols filter specified in the above script)

You can compare that data by running a screen at a particular date and using the same formula.


How to get ranking in my trading system?

Let us use the following basic trading system: Rank NASDAQ 100 stocks based on their 5-bar performance and buy the top 5 ones if they have a volume higher than N times previous day volume.

Our QS language formula would look like this:

Optimize("n", 0, 5, 1);
p = perf(close, 5);
r = comp(p, "rank");
buy = r <= 5 and volume > n*volume[1];


We previously created a ranking database (MyDb -> Perf) using the following formula:
string databaseName = "MyDb";
Formula.Create("Perf", "Perf(close, 50)", 5, 5, 5);


Now, how can we change our trading system formula to use the custom database instead of calculating ranking on each optimization?

Very simply, just replace "comp" line by:

r = GetData("MyDb", "Perf");

Note: It is important to use the same symbols filter in your trading system than the one you used in the ranking script.


Create Your Own Technical Stock Rating System

$
0
0
This article is the first part of a series where I will show you how to create a technical stock rating/ranking system and how to optimize it.

For now, let us just concentrate on creating the technical stock rating system.

You will see how easy it is to create rating systems in QuantShare. All it need is just few lines of code.
You may want to start by reading this basic tutorial on the QuantShare programming language.


Introduction

A stock rating system simply analyzes several indicators for a given universe. It gives a rate or rank to each stock and for each indicator then calculates the overall score for each stock. The stocks that have the best rating are bought then sold if their rating drops below a certain threshold.

In this example, we are going to create a rating system given the following indicators:

- Percent above or below 200-bar simple moving average
- 100-bar rate of change
- 14-bar relative strength index
- 100-bar Sharpe ratio of close series

A weight is also applied to each indicator. We will see that later.


Implementing the Stock Rating System

First, let us see how each trading indicator can be implemented in QuantShare:

- Percent above or below 200-bar simple moving average

r1 = close / sma(200);

- 100-bar rate of change

r2 = roc(100);

- 14-bar relative strength index

r3 = rsi(14);

- 100-bar Sharpe ratio of close series

r4 = sharpe(close, 100);


Now that we have the formulas, let us rank our stocks for each indicator. This can be done using the composite function (comp).

rank1 = comp(r1, "percentile");
rank2 = comp(r2, "percentile");
rank3 = comp(r3, "percentile");
rank4 = comp(r4, "percentile");


As an example, the stock that has the highest (100-bar rate of change) will get a percentile value of 100 and the stock that has the lowest value will get a percentile value of 0.

The last step consists of applying the global score formula for each stock and here is how:

score = rank1 * 0.3 + rank2 * 0.3 + rank3 * 0.15 + rank4 * 0.25;
score = comp(score, "rank");


In the first line, we assign a weight to each ranking formula then we calculate the global score.
In the second line, we rank stocks based on that score and this time we use the "rank" parameter instead of the "percentile" parameter.
This time, the stock that have the highest score value will get a rank value of 1, the second one will get a rank value of 2 and so on...


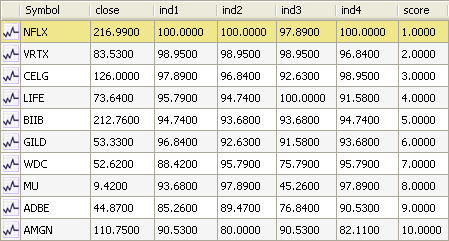
Stock rating data displayed using the screener tool.


Create a Trading System Based on this Rating System

If you never created a trading system before, please take a look at this how-to lesson first:
How to create a trading system

Creating a trading strategy based on our rating system is very simple.

All you have to do is:

- Create a new trading system, click on "Strategy" then on "Create trading system using the formula editor"
- Copy the formulas we have created previously:

r1 = close / sma(200);
r2 = roc(100);
r3 = rsi(14);
r4 = sharpe(close, 100);

rank1 = comp(r1, "percentile");
rank2 = comp(r2, "percentile");
rank3 = comp(r3, "percentile");
rank4 = comp(r4, "percentile");

score = rank1 * 0.3 + rank2 * 0.3 + rank3 * 0.15 + rank4 * 0.25;
score = comp(score, "rank");


- Add the buy rule (Buy the top 5 stocks)

buy = score <= 5;

- Add the sell rule (Sell the stock if its rank goes above 10)

sell = score > 10;


In the next post of this series, I will show you how to:
- Optimize weights
- Optimize indicator settings
- Optimize different list of indicators
- Optimize your trading system

QuantShare Trading Software: New Features in the 3.1.2 Version

$
0
0
New Trading Software QuantShare version (3.1.2) comes with the following features plus many minor updates and bug fixes.


Ranking System: Auto Rank Each Node

The ranking system tool (Analysis -> Ranking System Manager) has now a new feature (Auto Rank Each Node) that handles differently how ranking system is calculated.

When this feature is disabled and you have 2 indicators/nodes in your ranking system, here is how it works: (Default behavior)

The tool gets the indicator values, weights them then sums the results. Only after that, the results are ranked.

When this feature is enabled, each node is ranked.
The tool ranks each indicator values separately, weights the ranking (percentile value) then sums the results. Finally, the results are ranked.

I guess a table would explain better the changes in the ranking system logic.
We assume here that there is no weighting.


NB: Even if the auto rank feature is enabled, the QS language function (ranking) behaves as if this feature was disabled.


Find & Replace

You can now open a "Find & Replace" form in QS language and C# editors by using the CONTROL+F shortcut.

In this control, you have two options: Find and Replace

The Find option allows you to find a specific word in the document or in the selection
The Replace option allows you to replace a specific word in the document or in the selection


OCA and OSO orders

You can now create OCA (One-Cancels-All) orders using the money management script.

Here is an example:

TimeSeries goog = Data.GetPriceSeries("GOOG", "close");
_TradingOrder order = Orders.LimitOrder(goog[0] - 1);
order.AddLinkedOrder(true, "GOOG", 100, Orders.StopOrder(goog[0] + 1));
Orders.AddLongPosition("GOOG", 100, order);


The above example creates two orders:
- Limit order to buy GOOG at close-1
- Stop order to buy GOOG at close+1

When one of these orders is filled, the other order is automatically cancelled.

Here is how to create an OSO order (Order Sends Order) using the money management script:

TimeSeries goog = Data.GetPriceSeries("GOOG", "close");
_TradingOrder order = Orders.LimitOrder(goog[0] - 1);
order.AddChildOrder(false, "GOOG", 100, Orders.StopOrder(goog[0] - 5));
Orders.AddLongPosition("GOOG", 100, order);


The above example, create one order:
- Limit order to buy GOOG at close-1

When this order is filled, a new stop order to sell GOOG at close-5 is executed.

NB: You can apply these orders in the simulator or ATS.


Disable Money Management Script Programmatically

This new function is useful if you want to optimize your trading system by testing different money management logics.

Here is an example:
- Create a trading system then add two money management scripts (Example: different position sizing techniques)
- Add the following lines to your trading system (QS language)

Optimize("mm1", 0, 1, 1);
SetSimSetting(_DisableMMScript, iff(mm1, 0, -1));
Optimize("mm2", 0, 1, 1);
SetSimSetting(_DisableMMScript, iff(mm2, 1, -1));


This will create 4 combinations:
Combination 1: MM script 1 enabled, MM script 2 enabled
Combination 2: MM script 1 enabled, MM script 2 disabled
Combination 3: MM script 1 disabled, MM script 2 enabled
Combination 4: MM script 1 disabled, MM script 2 disabled


Backfill Using DDE Connections

Using your DDE connection, you can now backfill data by referencing another data provider or a downloader.

- Click on "N Data Feed(s)" at the bottom then click on "Settings" next to your DDE connection.
- Select "Backfill Settings" then click on "Backfill Source"
- You can either select "Another Connection" then select another data provider or you can select "Download Item" then select an existing downloader.

Now, each time you backfill a chart (that is linked to a DDE connection), QuantShare will either get historical data using another connection or get the data from the downloader you have specified (Example: 733)


QuantShare New Website Feature: Groups

$
0
0
Today, we just released a new feature that allows you to create public and private groups.

Members of a group will be able to share private items, discuss with other members and recommend trading items.


How to Create a Group

- In QuantShare website, click on "Groups" in the top menu
- Click on "Create a new group"
- Type the group name, description and select the group type (public or private)
- Click on "Create Group"


But why should you create a group?

There are several reasons and here are some:
- You have a website and you want to share trading items only with your readers or subscribers
- You have a team and you want to have a group where you can discuss and share trading items only with members of your team
- You want to create a specialized public group so that other traders can contribute
- You want to exchange trading items privately with other QuantShare members


How to Become Member of a Group

- Go to "Groups" page
- Click on the group link
- Click on "Send request to join this group"

If the group is public then you will be member of the group instantly.
If the group is private then a request will be sent to the admin of the group. Once the admin accepts your request, you will get a notification (Home - Notifications)

Once you become a member of a group, you will be able to download private trading items, display recommended trading items and create/respond to topics in the discussion board.

Important Note:
Please read the description of the group as the admin may put some specific conditions to be met in order to become a member.
Example: QuantShare Private Group
To be part of this group, you need to upload at least 3 trading items. One of these items must be private and associated with the "QuantShare Private" group


How to Share a Trading Item to a Specific Group

- In QuantShare application, select "Tools" then "Sharing Server"
- Select the item you want to upload (must be an item that you have created and not an item that you downloaded from the sharing server)
- Click on "Share selected item"
- Type the item name/title, description then enter the Group ID next to "(Group ID)"

How to find the group ID?:
When visiting a group, check the URL in the top bar of your browser. Example:
http://www.quantshare.com/index.php?option=group/group&lid=1

The group ID is the number located just after "lid=". In this case, the group ID is 1.

The Ultimate Guide to Create Trading Systems in QuantShare

$
0
0
This is the ultimate guide to help you get started with backtesting and creating trading systems in QuantShare.

Keep in mind that now we are just scratching the surface of what is possible to do with QuantShare.

At the end of this post, you will find a quick video presentation of some of the backtester features we will show you here as well as many links to other blog posts related to backtesting and creating trading systems.


What is a trading system?

Let us start by two definitions:

1/ A trading system is a group of rules and parameters that determine exact entry and exit points (signals) for a given security.

2/ Backtesting refers to testing a trading strategy using historic data. The main goal is to determine how profitable a strategy is if we invested in it in the past.


Let us Create our First Trading System

- Select "Analysis -> Simulator" to open the simulator/backtester
- Click on "New" at the top to create a new trading system

This will bring the trading system control where you can define all settings necessary to create your trading system:

In order to create a trading system you must define the following settings:

- Formula to define buy, sell, short and cover rules
- System Type (Long, short or both)
- Symbols (Stocks, ETFs, Futures...)
- Period or time frame
- Maximum number of positions
- Simulation start/end dates

These are the basic settings. Other settings include: Ranking systems, money management scripts...


Your First Trading System Formula

To open the formula editor, select "Strategy" icon at the top then select "Create trading system using the formula editor" tab.

The formula should be implemented in QS language.
QS language is an easy to use programming language you can use to create trading systems, charts, composites...

You can find a beginner guide here: http://www.quantshare.com/sa-499-quantshare-programming-language-tutorial

The formula would be applied to every security included in your trading system. Its main role is to generate buy/sell signals.

For a long only system, you should create two variables (buy and sell). In the formula editor, you can use the CONTROL+SPACE short-cut any time to display the list of available functions/indicators.

A basic system to buy every security on every bar would be:
buy = 1;

If you add the following line:
sell = 1;

Then your system will enter long on every bar and exit on the next bar.

Let us see now another example:
- Enter long when security's RSI (relative strength indicator) becomes higher than 70:
buy = rsi(14) > 70;

Notice that each time after you type your function (Example: RSI) and the first parenthesis, QuantShare automatically shows a tool tip with the definition of the function as well as the different parameters that it accepts.

Explanation:
The function name to create the relative strength indicator is "RSI". The simplest form of that function accepts one parameter which is the RSI period.
Therefore, here is how the RSI becomes higher than 70 should be translated into QS language:
rsi(14) > 70

In order to enter long when this condition is met, we need to associate it with the "buy" variable.
buy = rsi(14) > 70;


Other examples:

- Enter long when RSI crosses above 70:
buy = cross(rsi(14), 70);

- Enter long when stock reaches 10-bar high:
buy = (high == hhv(high, 10));

- Enter long when stock increase and exit when it decrease:
buy = close > ref(close, 1);
sell = close < ref(close, 1);


Using Multiple Rules:

If you want to set two or more rules to enter long then you can use the "and" or "or" operator:

Example:

- Enter long when close is higher than open and when volume is higher than 5-bar volume average:

buy = close > open AND volume > sma(volume, 5);

You can also write this formula like this:

a = close > open;
b = volume > sma(volume, 5);
buy = a AND b;


- Enter long when open is greater than previous bar's high OR when close is greater than previous bar's high

buy = open > high[1] OR close > high[1];

You can also write this formula like this:

buy = open > ref(high, 1) OR close > ref(high, 1);


Plot it on a chart:

Exercise: Say we want to buy a security when it increases 3 days in a row.

Which of the following formulas is correct?

buy = llv(close > close[1], 3) == 1;
buy = llv(close > close[1], 3);
buy = close > close[1] and close[1] > close[2] and close[2] > close[3];
buy = istrue(close > ref(close, 1), 3);


The answer is: They are all correct.

Not sure? Just plot the variable "buy" on a chart and you will see that they are the same.

Plotting a variable on a chart is a very good idea to have a visual confirmation of the values of that variable for every bar.

How to do that?
- Open a chart (View -> New Chart)
- Right click on the chart then "Create a new pane"
- Right click on that new pane then select "Edit Formula"
- Type something like:

buy = close > close[1] and close[1] > close[2] and close[2] > close[3];
plot(buy, "Buy Test1", colorRed);
buy = istrue(close > ref(close, 1), 3);
plot(buy, "Buy Test2", colorGreen);


Click on "Update Graph".

You can clearly see now that both "buy" variables are exactly the same.


Orders:

By default, an order to buy/sell at the open of next bar is generated when the buy or sell rule is true (=1).
You can change this using the following function: "SetSimTiming".

To exit at the close of the signal date (The signal date is the date at which the exit order was initiated - when "sell" was equal to 1):
SetSimTiming(_Sell, _Close, -1);

To exit at the open of next bar (default order):
SetSimTiming(_Sell, _Open, 0);


Trading System Type

In "System type" ("Strategy" tab), you can define whether you want to have a long, short or combined long/short trading system.

When "Long" is selected, your trading system will be able to buy or enter long securities.
When "Short" is selected, your trading system will be able to short securities (short-selling)

We already saw that in order to create long signals, we need to initialize (buy and sell) variables. In order to create short signals, we must initialize (short and cover) variables.

Example:
Short sell a security if its 5-bar performance is higher than 10% and cover it (buy back the security) if its 5-bar moving average drops below its 10-bar moving average.

short = perf(close, 5) > 10;
cover = sma(5) < sma(10);


Define Your Stops

A stop order is an order to sell a security if a certain condition is met.

Under the formula editor, you can choose one of these orders:
Stop Loss: Exit any position if it falls below a certain amount or a certain percentage.
Trailing Stop: Exit any position if it falls below a certain amount or a certain percentage starting from the highest (long trades)/lowest (short trades) price it reached since the position was initiated (This stop is used to protect profits).
Profit Stop: Exit any position if it reaches a certain amount or a certain percentage
N-Bar Stop: Exit any position after a specific number of bars


Symbols

This is the symbols or securities that will be used by your trading system.

If you want to create a trading system that trades U.S. stocks then you should select U.S. symbols. If you want your trading system to generate entries and exits for EUR/USD equity then specify EURUSD as symbol.

You can do that by clicking on "Symbols & Dates" icon at the top then adding one or several conditions in the symbols control.

As an example, you can select "Index" as a condition then add "NASDAQ 100" to reference NASDAQ 100 stocks only.
You can also add a "Custom Symbols" condition then type one or several symbols there.

Note: In order to select stocks by industry, sector, index..., you must enable QuantShare to manage your symbols. To do that, select "Symbol -> Auto-Manage Symbols", check the exchanges you want to track, check "Force the update of ..." option then click on "Save".


Maximum Number of Positions

You can update the maximum number of positions allowed in the trading system (at the same time) buy updating the "Number of positions" field (Under "Strategy").

Let us say you want to trade EURUSD and thus have specified EURUSD as symbol in your trading system. In that case, the number of positions should be equal to 1.

If you want to trade NASDAQ100 stocks and don't want to invest in more than 10 stocks at the same time then you should put 10 as number of positions.
Each position will get around 10% of the total capital.
If you set the number of positions to 5 then each position will get around 20% of the total capital.

This means that if you have $100,000 as equity and your trading system generates 5 orders (GOOG, AAPL, C, GE, MSFT for example) then the simulator will invest around $20,000 in each stock. If GOOG price is $555 then the simulator will buy 36 shares (36 * $555 = $19,980)


Trading System Period/Time frame

Under "Symbols & Dates", you can select the start/end period of your simulation/backtest as well as the time frame used by your trading system.

If you want your trading system to generate entry and exit signals using end-of-day data, just select "Daily" as time frame.
If you need an intra-day trading system then select an intra-day time frame such as tick, 1-second, 1-Minute, 1-Hour...

You can also have a custom time frame by selecting "Custom" next to "Select a time frame". Once selected, type the number of seconds that is needed to build a single bar.
To create a 1-minute, 30 seconds time frame, just type: 90 (60s + 30s).

Important:
If you want to backtest a daily trading system, make sure you have downloaded EOD data for the symbols referenced by your trading system.
If you want to backtest an intra-day trading system, make sure you have downloaded intra-day data for the symbols referenced by your trading system.

You can download data using the downloader tool (Download -> Download Manager).
We do have several downloaders in the sharing server (both for EOD and intra-day data).


Ranking Your Securities

Think about the following situation:
On day N, your trading system generates 5 signals and your portfolio is allowed to take only 3 positions.
In this case, which securities will be bought first?

By default, symbols are ordered by alphabetical order and the first one is taken first.
But you can update this default behavior by ranking securities based on a given formula.

Let us say that you want the stock with the best 5-bar performance to be purchased first.
In that case, you just need to type:

SetSimLongRank(perf(close, 5));

This is for long orders. You can also specify a ranking formula for short orders by typing:

SetSimShortRank(perf(close, 5));


Backtesting a Trading System

Before we backtest our trading system, select "Symbols & Dates" icon then specific the start and end backtesting period at the bottom.
After saving your system, select it in the simulator manager (Analysis -> Simulator) then click on "Simulate" or "Backtest". When done, you will get a detailed report on how your trading system would have performed in the past.


By now, you should be able to create and backtest some basic trading systems. But if you want to create more advanced strategies and learn more about QuantShare powerful backtesting features I suggest you take a look at the following blog posts:

Trading System Implementation:
Example of a trading system implemented in QuantShare Software
Trading System: Buy Stocks based on their Sharpe Ratio Rank
Trading System: Buy stocks with the highest Sharpe ratio
Trading System: Moving average crossover and few others buy and sell rules
How to turn any ordinary trading strategy into a very profitable one
Buy the best/top rated stocks or how to create powerful rank based trading systems
Backtesting trading strategies using intra-day data

General Information:
How to build and backtest a robust stock trading system
Troubleshooting a Trading System
9 mistakes you should avoid when backtesting an end-of-day stock trading system
Reducing risk and increasing return by combining several trading systems
True portfolio simulation applied to trading systems
3 ways to rank stocks in a trading system - Simulator and Potfolio
6 ideas to implement in your portfolio to reduce your trading risk
6 techniques to improve the performance of your stock trading strategy
Trading System Analysis: Backtesting report and custom measures

ETF Systems:
Select the best ETFs combination to maximize your return and reduce your investment risk
Backtesting a Strategy Based on Bond and Stock Index ETFs
Create Profitable Trading Strategies with Exchange Traded Funds (ETFs)

Money Management:
Basic trading system implemented using the money management tool
Create a trading strategy using the money management tool - Part 1
Create a trading strategy using the money management tool - Part 2
Money Management: Optimize a trading system
Several money management strategies in a trading system
Money Management: Scale-in Trading Strategy
5 position sizing techniques you can use in your trading system
How to combine long, short and custom portfolio strategies within a trading system

Advanced Techniques:
Day Trading: A trading system that combines intraday and EOD data
How to Select the Best Market Indicator for your Trading System
4 indicators to create adaptive trading systems
Intermarket Analysis - Correlation and Trading Strategies
How to create buy and sell trading rules based on News Data
4 original breadth indicators you should consider in your market timing strategy
How to Backtest an Intraday Stock Trading System with EOD Ranking
Backtesting chart patterns using the auto support and resistance indicator
10 masks to create thousands of rules to use into your trading system
How to choose which technical indicators to use in your trading system
How to create a trading system, screen and composite using earnings surprise data
How to Switch On/Off Trading Rules in Your Stock Trading System
How to Backtest Each Stock or Asset Individually
How to Backtest Your Trading System for Each Industry

Let QuantShare Manage your List of Securities

$
0
0
What are the advantages of having QuantShare handles ticker symbols for you?

- You don't have to worry anymore about which stocks were added or removed from a specific exchange.
- QuantShare updates all symbol information for you (title, indices, industry, sector...). Later you can use that information to filter securities.
- Automatically download end-of-day and intraday data for your securities
- Have stocks from different exchanges (U.S. and International) without symbol name collision (Two stocks from different exchanges having the same name)

NB: The data is updated about once a month. So if a new stock starts trading today, you may see it only after few days. Of course, you can add symbols manually.


How It works?

Start by selecting "Symbol" then "Auto-Manage Symbols"
Now, the most important part consists of selecting the exchanges you want to track.

Say you are a U.S. stock trader. You will probably want to have a database consisting of NYSE, NASDAQ and AMEX stocks (maybe also OTC stocks).
In that case, you will have to check all these exchanges. You can use the "Search" input box to quickly find any exchange.

In our example, you will have to check the following exchanges:
New York stock exchange
NASDAQ
American stock exchange
Over the counter

When done, click on "Save".

QuantShare will now import a list of securities that are trading in the exchanges you specified and import them into your database.
But before that, it will bring a form to inform you about the number of symbols to add, update and remove.

Definition:
Symbols to Add: These are securities that are listed on one of the select exchanges but cannot be found in your QuantShare database.
Symbols to Update: These are securities listed on one of the select exchanges and whose info (indices, sector, industry...) is different from the info available in QuantShare database.
Symbols to Remove: These are securities that are found in your QuantShare database and not in one of the exchanges you have selected.


- Click on "List" to display these symbols
- To disable a function (add/update/remove), just uncheck the checkbox next to it

Click on "Accept" to start the database update process.


What's next?

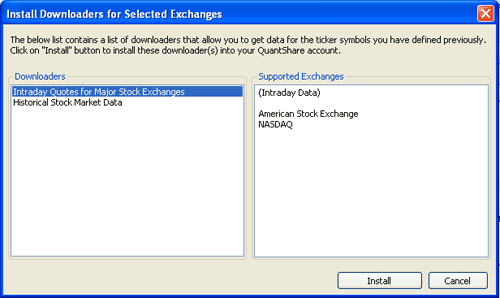
Depending on the exchange you choose, QuantShare will get the appropriate end-of-day and intraday downloaders for you. These are downloaders you can use to retrieve end-of-day and intraday data for your securities.


Just click on "Install" to install these downloaders.

Wait... We are not done yet.

After that, QuantShare prompts you whether you want to start the downloading process or not. If you say "Yes" then EOD data for your all your securities will be retrieved automatically.


Need Help with Other Options?

Let go back to the initial auto manage symbols form.

You may have noticed that there are several other options. Let us go through each option:

Force the update of symbol information: This option is useful if you have manually imported securities and would like to fill security's information such as market, indices, industry...

Symbol Name: Define what symbol name to give to your securities. Each security can have several symbol names (name, name1 and name2). This is useful if for example you have a downloader or data provider that uses different name convention.
As an example, you can have the exchange name in "Name" field and the yahoo compatible name in "Name1".

Actions: Specify the default action to take when securities are found (and not available in your database), updated or removed.

Exchanges: Two buttons are available here.
"Reload Exchanges list" button reloads the exchange list.
"Verify Symbols changes" button tells you what changes need to be done to your database without performing these changes.


Here is a video presentation of the auto manage symbols feature:


How to Reference Drawing Studies in QS Formulas

$
0
0
Say, you draw a resistance line and want to track when stock prices increase 5% above that line.
You can use the Alerts tool (Available in the real time version) or create your own formula and use it in screener, watchlist...

This can be accomplished using a unique QuantShare function that allows you to reference drawing studies from QS formulas.


Using the Alerts Tool

- Open a chart
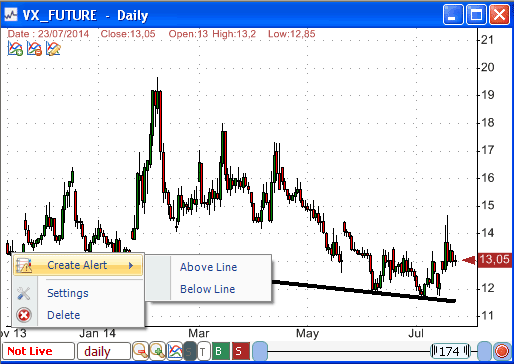
- Select the "Line" drawing tool
- Draw a trendline
- Right click on that line and select "Create Alert -> Below Line"

This will create an alert for the analyzed security. The alert will be triggered when the close price crosses below the study's line.


How to use the "DrawItem" Function


In the previously created alert, notice that the formula used as condition looks like this:

close > DrawItem('166967', 'Line')

The "DrawItem" function allows you to reference a hand-drawn study in QS programming language.

That function accepts two arguments:

Argument1: Study Name/ID
Argument2: Study Element Type

The study name can be found next to the "Name" field when you right click on a drawing item then click on "Settings".
You can of course update the "Name" value and set it to any value you want.

The study element type is the study part that should be referenced by the formula.

As an example, if you use the trendline, you will have only one type "Line".
If you use the Fibonacci Extension, you will have several types (Line 0%, Line 38.2%, Line 50%, Line 61.8%...). You can reference any one of these lines.

The easiest way to know the different element types available is by typing the formula then using CONTROL+SPACE shortcut.

Type:
DrawItem('166967', [WHEN THE MOUSE CURSOR IS HERE, USE CONTROL+SPACE]

Where "166967" is the study name.

Note that you can also reference other type of drawing items including ellipses and rectangles. You can for example detect whether the last security price is within a hand-drawn ellipse or not.

Example:

- Draw a trendline then detect when the security crosses above this trendline by typing:

a = cross(close, DrawItem('', 'Line'));

- Draw Fibonacci Extension on chart then detect when the security drops below the 127.2% level by typing:

a = close < DrawItem('', 'Line 127.2%');

- Detect whether security prices are within a rectangle (you have drawn)

a = DrawItem("522028", "Box", close);

Note that rectangle and ellipse studies require an extra time-series parameters so that QuantShare knows which time series is inside or outside the rectangle or ellipse.


Using the Screener, Watchlist and Backtester Tools

Since all these tools use the QS programming language, you can use the above "DrawItem" function to reference and access hand-drawn studies data.

If you want to analyze several stocks for, let us say, a support breakout then draw your support line in each stock's chart and have the same name for each of one of these stocks.

Example:

- Open GOOG chart, create a resistance and name it "Resistance100"
- Open AAPL chart, create a resistance and name it "Resistance100"
...

Open the screener tool, and then type the following formula to detect a resistance breakout:

filter = close > DrawItem('Resistance100', 'Line');

If you want to detect a stock increasing 5% above that resistance line, type:

filter = close > 1.05 * DrawItem('Resistance100', 'Line');


Custom Drawing Tools

Besides built-in drawing tools, you can also reference custom drawing tools (Tools -> Custom Drawing Tools).
Each time you create a line, rectangle, ellipse... in the script editor, you will have to define a name for it. You can use that name later to reference parts of your custom drawing tool.

Example:

Functions.PaneObject.DrawLine("My Line", 0, 0.7, 20, 0.65); // Here, the line's name is "My Line"

Your custom drawing tool can create hundreds of lines; you will be able to reference each one of these lines very easily using QS programming language.
For a beginner tutorial of the QS language, please read: QuantShare Programming Language Tutorial

How to Backtest a Strategy from a Chart

$
0
0
The idea behind this post is to allow you to quickly backtest a strategy using chart's data.
Let us say, you are displaying Google chart with some indicators and you want to know what would be the performance of a system that uses one of these indicators.

What we want to do here is create a script that just by clicking on it, would get chart's symbol, time frame and formula and use that to backtest a new strategy.

Now, let me show you how easy it is to do such thing.


Getting Chart Details

First, let us create a new script.

- Select "Tools -> Script Editor"
- Select "File -> New" to create a new script
- Type a name then click on "OK"

Once done, get the script code from here and paste it in the formula editor (CONTROL+V shortcut)

- Add the script to the bookmark panel for easy access (Settings -> Add Current Script to Bookmark Panel)
What is the Bookmark Panel?

Here is a brief description of what the script does:
- Get selected chart
- Get symbol, time frame and whether the chart is in EOD or Intraday mode
- Loop through each pane and each formula and get the last formula that contains either the variable "buy" or "short"

For more information on how to create trading system, please check this post: The Ultimate Guide to Create Trading Systems in QuantShare

- Create a new trading system (You may update the first variable "tradingSystemName" in this script to set the trading system name)
- Updates the trading system with the chart symbol, formula...
- Backtest the trading system and display the backtesting report


Backtest a Trading System from your Chart

Here is an example on how to use this script:

- Create a new chart
- Create a new pane by right clicking on the chart then selecting "Create new pane"
- Right click on the new pane then select "Edit Formula"
- Add the Williams' %R indicator as well as two lines (-20 and -80 thresholds)

a = Willr(14);
Plot(a, "Willr", colorBlack, chartLine, StyleSymbolNone);

plot(-20, "");
plot(-80, "");


- Click on "Update Graph" to display the indicator

Let us say you notice that when Willr crosses above -20 line, the stock increases and you want to test this.

- Add your buy and sell rules then click on "Update Graph" to save the formula
buy = cross(a, -20); // Buy when Willr crosses above -20
sell = cross(-20, a); // Sell when Willr crosses below -20


- Backtest your trading system by double clicking on the script button (which should be located in the bookmark panel)

- After few seconds, you get your trading system's backtesting report.


Optimize your Trading System

Besides doing simple backtests, you can also optimize a trading system right from your chart.
In order to enable optimization, just use the "Optimize" function.

Here is how it works:

Instead of typing the following rules in your formula:
buy = cross(a, -20);
sell = cross(-20, a);


Type:
Optimize("v1", -50, -10, 10);
buy = cross(v1, -20);
sell = cross(-20, v1);


Execute the script and you should get your optimization report ready in few seconds.


Let me Show You How to Create Hundreds of Profitable Trading Systems

$
0
0
In this guide, I show you exactly how to create a trading system template in 10 minutes and let that template generates profitable trading systems for you automatically.

The following instructions will guide through the process of finding trading rules, creating them, setting up a trading system, defining your objectives, optimizing/backtesting your strategy.

The trading system template we are going to use in the post is a combination of a stock picking and stock rotational system. I am referring to stocks here by you can use ETFs or any other securities instead.


Find Trading Rules Ideas

Since the trading system template we are going to use is a mix between a stock picking and a stock rational system, we will need to gather here a list of trading rules (X > Y�) and a list of measures (RSI, ROC�).

This part is very important, so we have to choose our rules carefully. We can of course select a set of rules, perform the process then repeat it again with another list.
The number of rules/measures is unlimited so it may be a good idea to test these rules and only select the best ones. This can be done using the rules analyzer tool of QuantShare.

Let us build our list of rules now. Just concentrate, think about all the trading systems you know or built and just write some rules. An example of list would be:
rsi(14) > 70
roc(30) > 5
close > open
high > high[1] // High higher than previous bar high


For measures (rotation), we can have:
rsi(14)
roc(30)
close / open
high / low


Of course you can have also fundamental analysis rules
or any other kind of rules (such as rules using put/call volume data, sentiment analysis rules, news rules�)

If you need inspiration, you can check and download the different list of rules shared by QuantShare members on the sharing server.


Implement Your Trading Rules

Let us build a list of rules item from the rules you have gathered.
- Select "Analysis -> Rules Manager"
- Click on "Create" then type the list name

Remember that we have to create two lists. Once for stock picking and one for stock rotation.

One quick way to add several rules to a list would be to select your list, click on "Tools -> Create Rules from Text", type your rules then click on "OK".

You can also copy rules from one list to another by selecting one or several rules (Keep CONTROL pressed), dragging/dropping rules into the clipboard (bottom/left corner of the rules manager form) then clicking on "Copy" (in same clipboard control) and dragging/dropping into the new list of rules.

The "Rules Manager" tool can also help you create several variables from a single rule/measure, for example by varying a specific parameter or threshold.

Here is how it works:

- Add a rule. Example: rsi(14) > 0
- Replace "14" by "a" or any keyword to make the "Optimization Grid" appears at the bottom
- Update the "min", "max" and "step" fields to create several variations of the same rule.

You may want to check the following blog post for more details:
10 masks to create thousands of rules to use into your trading system

I have already prepared two list of rules. You can download them here:
1523
1522


Create the Trading System Template

The trading system logic is very simple:

- Consider only stocks that meet the stock picking criterion
- Rank all stocks based on two metrics
- Buy the top 5 stocks (stock rotational)
- Rebalance monthly

You can download the template (1524). But if you want to learn how it was created and maybe tweak it later, just keep on reading.

If you are new to QuantShare, you may want to check this blog post to learn how to create trading systems.
Now, let us see how we can implement this strategy in QuantShare.

- Consider only stocks that meet the stock picking criterion

ct = ApplyRule("", "stock_picking", -1); // Return number of rules
Optimize("a", 0, ct - 1, 1); // Optimize variable "a" from 0 to Number of rules -1
rule1 = ApplyRule("", "stock_picking", a); // Execute the rule specified by the index value referenced by variable "a"


Notes: Here was assume that the stock picking list of rules we created previously is named "stock_picking".

- Rank all stocks based on two metrics

ct = ApplyRule("", "stock_rotation", -1); // Return number of rules
Optimize("r1", 0, ct - 1, 1);
Optimize("r2", 0, ct - 1, 1);
rot1 = ApplyRule("", "stock_rotation", r1); // Get the first metric given the optimizable variable r1
rot2 = ApplyRule("", "stock_rotation", r2); // Get the second metric

rot1 = comp(rot1, "percentile"); // Rank stocks based on the first metric (result is from 0 to 100)
rot2 = comp(rot2, "percentile"); // Rank stocks based on the second metric

Optimize("w1", 0, 100, 10); // Optimize the weight to be given to the first metric
rot = rot1 * w1 + rot2 * (100 - w1); // Calculate ranking based both metrics


- Buy the top 5 stocks (stock rotational)

SetSimLongRank(rot); // Instruct QS to first buy stocks with the highest rank
newmonth = 1; // Detect a new month
buy = rule1 and newmonth; // Consider only stocks that meet the stock picking criterion and buy at the beginning of the month


- Rebalance monthly

sell = newmonth; // Sell all position at the end of the month (next bar open)

Note: You can add any fixed rule just by using the "and" operator in the "buy" variable.
Example:
buy = buy and close > 2; // Enter long only stocks whose price is above $2


Optimize Your Strategy

We have four optimizable variables in our trading system's formula.

Suppose, the stock picking list of rules contains 20 rules and the stock rotation list contains 10 rules or metrics. Given that, our system would have exactly 22,000 combinations (20*10*10*11)

If you add more trading rules to both lists (say 150 for the first one and 50 for the second one), the number of combinations that could be generated by our system would be: 4,125,000 (More than 4 millions).

Let us backtest now those 4 millions systems and for that we will use the AI Optimizer tool of QuantShare. Clearly the optimizer tool will no backtest every single system, but it will use advanced algorithms (Genetic algorithm or PBIL) to find the best systems.

- Select "AI -> Optimize" from the menu
- In the new Optimizer form, click on "Create"
- Select "Population-based incremental learning" as optimization method and below this select "Trading System"
- Update PBIL algorithm settings if necessary then click on "Next" ( More info here )
- Next to "How to optimize your trading system", select "Using optimize variables in a formula"
- Click on "Load Trading System" then select the trading system we created previously
- The total number of variations or combinations should be displayed now
- Click on "Next"
- Click "Symbols & Dates"
- Select the symbols you want to backtest and the start & end dates of the simulation
- Click "Ok" then "Next" to create the optimize item
- Select that item then click on "Run" to start the optimization process


Define the Expected Performance/Risk

Every trader is different. Some dislike risk while others are looking for performance no matter the risk.

The fitness formula available in the AI Optimizer tool allows you to define your ideal trading system.

If you are looking for the best performing systems, just use the default formula:
fitness = AnnualReturn;

If you want a system with the highest Sharpe Ratio, type:
fitness = SharpeRatio;

If you want a system that had positive return every year, type:
Fitness = AnnualReturn;
for(int i=0;i < YearlyReturn.Count;i++)
{
if(YearlyReturn[i] < 0)
{
Fitness = 0;
}
}


Note: If you get an error after clicking on "Compile", make sure C# language is used instead of JScript (Bottom/Right corner of the script editor)


Is Your Trading System Robust Enough?

While the optimization is running, you can click any time on the "Show Report" button of the "Optimize Item" form. This will display the best trading strategies ranked by the fitness value.

You will most likely find many profitable systems in the list, but we need to make sure that these systems are robust enough to be considered for live trading.

For this, let us do an out-of-sample test. The idea is to backtest the trading system again another period or set of symbols.

- Click on "Settings"
- Select a different list of symbols (maybe symbols from another market or that belong to a different index) and/or a different start/end period
- Click on "Ok" then on "Start" to begin the out-of-performance testing
- Two new columns will be added (Out-of-sample fitness value and the difference between the in-sample and out-of-sample results)

The trading systems that pass the out-of-sample test can now be considered for paper trading.
You should always consider paper trading a system before investing any money in it.

In order to generate daily buy/sell signals from our system, you need to add it to a portfolio:
- Select "Portfolio -> Portfolio" from the menu
- Click on "New"
- Select "End-of-day"
- Click on "Next"
- Click on "Add Trading System" then add your trading system
- Click on "Next" twice


What To Do Next?

Once the template is built it would take you only few clicks to generate thousands of new and different trading strategies.

Here is what you can do next:

- Run the optimizer again to get different set of trading systems
- Play with optimize PBIL settings to generate more systems
- Add/Remove trading rules then optimize your template again
- Add future optimizations (next paragraph)


Add Further Optimizations

The trading system we used in this article is simple but very powerful. The fact that the optimization is done to test different rules (rather that parameter like the moving average period) allow us to quickly test different varieties of systems. Depending on the number of rules you have, you can easily come up with many profitable and interesting systems.

As we saw earlier, the template can easily generate millions of systems but we can update it to generate several millions of billions of systems. To do this, let us add three further optimizations:

1/ Vary the number of securities to hold at the same time

As you saw earlier, the system buys the top 5 securities (Stocks, ETFs, or any other asset type)

Of course, the number of securities to purchase can be optimized.
To do this, just add the following lines at the top of the trading system formula.

Optimize("nbs", 1, 10, 1);
SetSimSetting(_NbPositions, nbs);


This will multiply the number of potential trading strategies by 10 and would allow us to test different systems that can hold from 1 to 10 securities at the same time.

2/ Specify whether to use the stock picking rule or not

We could add here an optimizable variable that either turns on or off the stock picking rule.
Remember the stock picking rule's data is saved in the variable "rule1". What we need to add here is simply:

Optimize("t1", 0, 1, 1);
rule1 = rule1 * t1;


// "t1" variable can either get a value of 0 or 1.
If it is equal to 1 then the "rule1" remains unchanged. If it is equal to 0 then "rule1" will be equal to 0 and thus will be turned off. Very easy, isn't it?

If needed, more info can be found here: How to Switch On/Off Trading Rules in Your Stock Trading System

3/ Adding a third ranking rule

In order to add a third ranking rule, we just need to create a new optimizable variable (that will choose the third ranking rule) and define new "weight" variables (one for each ranking measure).

Here is what you should add:

Optimize("r3", 0, ct - 1, 1);
rot3 = ApplyRule("", "stock_rotation", r3); // Get the first metric given the optimizable variable r3
rot3 = comp(rot3, "percentile"); // Rank stocks based on the second metric


Now, we need to replace:

Optimize("w1", 0, 100, 10); // Optimize the weight to be given to the first metric
rot = rot1 * w1 + rot2 * (100 - w1); // Calculate ranking based both metrics


By:

Optimize("w1", 0, 100, 10);
Optimize("w2", 0, 100, 10);
Optimize("w3", 0, 100, 10);
rot = rot1 * w1 + rot2 * w2 + rot3 * w3;


What else could be optimized?
- Apply several money management scripts and create a variable to choose only one among the list (More Info here: Disable Money Management Script Programmatically )
- Add stop rules and optimize thresholds
- Add a fourth or fifth ranking rule
- Add a second stock picking rule

Of course there is no limit regarding the number optimizations that can be done to our template and we encourage you to post any new idea in the comments section below. Thank you.

How to Create a Custom Real-Time Table using QS Trading Software

$
0
0
Today, I am going to show you how to create a basic real-time RSI table. The table/grid we will implement today will look like this.


A video showing the different steps can be found below.


Grid Editor

The grid editor is a powerful tool that allows you to create excel-like tables. This is a unique feature of QS trading software.

The main advantage over Excel is obviously the fact that you can reference QS data very easily (End-of-day, Intraday and Real-time).
Besides that, there are some unique features in this tool. We can cite for example, conditional cell formatting, ability to reference data from multiple data providers, ability to combine EOD and Intraday data, ability to use QS language and C# scripts, ability to sort portion of cells, ability to add real-time charts, ability to add buttons and other controls...

Let us create a new grid now.

- In your QuantShare Trading Software, Select "Tools -> Grid -> Grid Editor"
- Create a new grid by selecting "File -> New"
- Select "5" as number of rows and "3" as number of columns then click on "OK"

Headers:
- Type "Symbol" in cell A1, "Close" in cell A2 and "RSI" in cell A3.
- Select all cells in the first row, click on "Font Color" at the top then select "White" color
- Select all cells in the first row again, click on "Cell Back Color" at the top then select "Black" color
- Click on "Bold" button

Data Feed:
- Select all cells
- Right click then select "Data Feed" and choose a real-time data provider (must be already connected - Example: Interactive Brokers)
- Each cell is now associated with that data provider

Symbol Column:
- Select the four cells under "Symbol" cell
- Right click then select "Editable Cell -> Yes"
- These cells will be editable once displayed in the output/live mode
- Type a symbol name for each cell under the "A" column

Close Column:
- Click on the cell under "Close" cell
- Click on "Fx" button at the top (This where we select our formula for that cell)
- Select "Intraday" category then "GetClose" as function
- Click on the button next to "Symbol Name" then select cell A2
- Click on "OK". Alternatively, we could just type "A2" in the input box next to "Symbol Name"
- Type "0" next to "Time Frame"

Note that "GetClose" function will always return the last price value no matter the time frame used. The time frame is useful when using the "GetClose" function that accepts three parameters (The last parameter being the "Lag" - Close price of the current bar minus Lag)

- Click on "Add"

If your data provider is working and you have specified a symbol name then the new cell will be updated automatically with the last price of that defined symbol.

- Select the same cell
- Click on its right/bottom corner then move your mouse down to the last cell. This will create a copy of that cell. Formulas will be updated automatically. This means the formula for cell "B3" will be "=GetClose(A3,0)" instead of "=GetClose(A2,0)"

RSI Column:
- Click on "Formulas" button in the above toolbar
- Click on "Add Formula"
- Type "rsi" next to "Name" (This is the formula name)
- Select "Realtime" next to "Data Used"
- In the script editor, type:

cell = rsi(2);

- Click on "Compile" then on "Close" at the top
- Double click on the cell under "RSI" cell then type the following formula:

=Formula.rsi(A2, 60)

This is the formula we just created. By default QS formula accepts two arguments (Symbol and Period in seconds or days)

- Right click on that cell again then select "Cell Format -> Number" then "OK".
- Click on the cell's right/bottom corner then move your mouse down to the last cell


Conditional Formatting

Since all cells in this table will update in real-time, let us add some conditional formatting and change the background color of each cell (for few milliseconds) each time a cell receives real-time data.

It is very easy to do that using the QuantShare's grid tool.

- Select all cells then right click and select "Conditions"
- Right click on the new control then click on "Add Condition"
- Choose "Always" under "Operator". This instructs QS to apply that condition each time the cell value changes
- Keep "Formula" empty
- Select "BackColor" under "Type"
- Select any color under "Result"
- Type "5" under "Value For". This tells QS that these changes must be applied for 0.5 second only.
- Click "Submit" and watch your beautiful table


How to Sort Rows

Manual and automatic sorting is also one of the great features of this tool.
You can sort all cells or just part of them. In this example we will sort all cells so select them, right click then select "Create a list". If the header name changes, select it and type "Symbol / Close / RSI" again.

Manual Sorting:
- Click on any column header
- Select "Sort" then "Ascendant" or "Descendant"

Automatic Sorting:
- Click on any column header
- Select "Auto Sort" then "Ascendant" or "Descendant"

Your table is now automatically sorted in real-time. This means that in case you sort by "RSI / Descendant" then the first row will always contain the stock that has the highest RSI value.


Display Real time Grid in QuantShare Trading Software

Now that we are done creating our table, let us display it in QuantShare.
- Select "File -> Save As", enter a new name for your table then click on "Save"
- In QuantShare, select "Tools -> Grid -> Open Grid"
- Select the grid we just created then click on "Load Selected Item"
- You can dock that grid by pressing on ALT then moving it

You can update any symbol by double clicking on the cell then typing a new symbol name.

You can also add new symbols by right clicking on the grid then selecting "Add Row". This will automatically create a new row by copying all settings from the previous row.
To enable this, select "View -> Show/Update Output" in the grid editor then check "Allow adding/removing rows".

If you do not have any real time data provider yet, you can test this using the "Random Quotes" or "Yahoo Provider" feeds.

Note that when cells are sorted, any new added row will not be included in the sorted listed. That default behavior will be changed in the next release.


In a next post, we will show you how to create:
- Real-time charts within a table (Line, bar, pie�)
- C# scripts and how to create amazing things. For example, we can add another cell that counts the number of stocks that are advancing in our list. Or a button that automatically gets symbols from a watchlist and add them to our table.

Any ideas or comments, please hit the "Add a comment" button below.


3 Items To Get and Trade the News In QuantShare Platform

$
0
0
Within QuantShare, you can download news, displays them on a chart and even create composites and trading systems based on news data. In this article, I will show you first how to download news data, then how to trade and create charts based on these news.


Here are three trading items you can use in QuantShare to download news data for U.S. stocks.

Google News

Using this downloader, you will get news data for almost every listed U.S. stock. The data is available in RSS format. It is parsed and added automatically to a custom database "google_news".
The database contains the following fields (Date, Title and Description)

Example of RSS Link:
http://www.google.com/finance/company_news?num=1000&output=rss&q=A

106 News items are available here for Agilent.

Example of one News Item:
Date: 04/11/2014 22:35:51
Title: One Reason Agilent Technologies (A) Stock Closed Down Today
Description: One Reason Agilent Technologies (A) Stock Closed Down Today
TheStreet.com - Nov 4, 2014

Well Fargo said it lowered the measurement company's rating...

You can get trading news data from Google by using the following item:
http://www.quantshare.com/item-924-historical-stock-market-news


Yahoo News

This item gets news data for U.S. stocks from the RSS feed provided by Yahoo Finance.
This item creates a custom database (yahoo_news) with the following fields (Date, Title, Category).
Unlike the Google news downloader, this item gets news data only for recent days.

Example of RSS Link:
http://finance.yahoo.com/rss/headline?s=A

20 News items are available here for Agilent.

Example of one News item:
Date: 06/11/2014 16:47:10
Title: Agilent Technologies Advances FTIR Microscopy Imaging
Category: [at noodls] - Hardware, Software Enhancements Bring Power of Synchrotron to Lab Bench SANTA CLARA, Calif., Nov. 6, 2014 Agilent Technologies Inc. (NYSE: A) today introduced significant enhancements to its Cary 610 and ...

You can get trading news data from Yahoo by using the following item:
http://www.quantshare.com/item-88-yahoo-news


Stocktwits

In case you want to download tweets for your favorite stocks, we have a downloader item for that as well.

Using this item, you can get the 30 most recent tweets stored in a custom database "stocktwits" with the following fields:

Title: The tweet message
Account: The name of the user that created that tweet.

Example of one tweet:
Title: $AA Do any of you savvy AA followers have thoughts about a possible share buyback or div increase next year?
Account: ToesInSand


Display Trading News

You can displays news data for every active stock just by selecting "Tools -> Database Data"
Once the new form appears, select the appropriate database then make sure that "Filters" (at the bottom) is set to "Selected Chart".

You can choose which columns to display by click on "Column Settings" at the bottom.


Show News on a Chart

Using the same control, click on "Show data on chart" at the bottom. This will automatically display news data for the active/selected chart. You can of course customize the display by clicking on "Settings -> Edit Settings" at the bottom.

Note that grid rows can have different colors. For example: recent news (less than 5 minutes) is colored differently that a news that is 2 hours older. Again, settings can be updated by clicking on the same button below ("Settings -> Edit Settings").


Trade the News

QuantShare makes it easy to access quantitative and non quantitative data. It also makes it easy to transform non-numeric data into a quantifiable form.

Here are few functions you can use for that:

GetDataCount:

This built-in function allows you to count the number of occurrences of a specific field.
Example: Count the number of news items
a = GetDataCount('yahoo_news', 'title');

Example: Count the number of news items for a specific symbol
a = GetDataCount('yahoo_news', 'title', 'AAPL');

GetDataStringCount:

This is also a built-in function and it calculates the number of occurrences of a specific field that contains a defined word

Example: Count the number of news items that contains the word "buy"
a = GetDataStringCount('yahoo_news', 'title', 'buy');


GetDataCountInside:

This function counts the number of occurrences that occurred between a specific period

Example: Count the number of news items that occurred between 12h and 13h
a = GetDataCountInside('yahoo_news', 'title', 12, 13, P_Hour);


ContainsWords: (You can download this function here: 186)

This function allows you to specify several words and it would return 1 or TRUE on bars where a custom field contains one of these words.
a = ContainsWords('yahoo_news', 'title', 'Buy,Jump,Big,Rise,Increase,Good,Excellent,Great');


GetField: (You can download it here: 981)

If you want to optimize your strategy based on a list of words then this function will come in handy.
Check the item description for a detailed example on how to use this function

News_sentiment: (You can download it here: 304)

By providing a list of positive and a list of negative words, this function can count the number of titles that contains the positive words and subtract it to the number of titles that contains the negative words, thus providing you with a sort of basic sentiment analysis.

Example:
a = news_sentiment('yahoo_news', 'title', 'buy,good,better,bull', 'sell,bad,lower,bear');

For advanced sentiment analysis, you can use the Alchemy API as described in this blog post:
Sentiment Analysis: How to measure the sentiment score of your stock tweets

A very simple trading system that trade news would be to enter long if a stock has 3 times more news that the average of the past 25 trading bars:
a = GetDataCount('yahoo_news', 'title');
buy = a > 3 * sma(a, 25);


Other related blog posts:

Download quotes, news, sentiment, fundamental... data using QuantShare
How to create buy and sell trading rules based on News Data
How to create a trading indicator that uses stock news
How to speed up quotes and news downloads

Viewing all 106 articles
Browse latest View live