Quantcast
Channel: QuantShare
Viewing all 106 articles
Browse latest View live

Correlation Between Multiple Trading Systems

$
0
0
There are two ways to backtest multiple combinations of strategies in QuantShare.

Initially we have implemented a tool called "Combined Trading Systems" where you can add multiple trading systems then backtest the different combinations.

Later, we have added a much powerful tool called "Meta-Strategies". With that new tool, you can combine, optimize and rebalance multiple strategies as it was a single trading system ( How to Create Your First Meta-Strategy).

In both tools, you can add as many strategies as you want but the problem is the time it takes to backtest all the combinations.
With just 5 strategies, QuantShare would need to backtest about 31 trading systems.
If you increase the number of strategies to 10, QuantShare would need to backtest about 1023 trading systems. That would take a lot of time, and that number would increase exponentially as you add more systems.

In case you have many strategies, the best way to find the best combination would be to calculate the correlation between the different strategies then pick the ones that are the less correlated. Once done, you can input these strategies in the meta-strategy tool and search for the perfect combination.

Here is how to perform a correlation between multiple trading systems:
- Select "Analysis" then "Simulator"
- In the simulator manager tool bar, select "Tools" then "Combine Trading System".

In case you don't find "Tools" menu, click on the green "+" icon to expand the tool bar menu.

- Click on "Add Trading System(s)"
- Check the trading systems you want to include in the correlation matrix
- Click on "Load Checked Item(s)"
- Click on the "Correlation" button at the bottom

Depending on the number of trading systems you added, wait few seconds/minutes for the calculation to be completed and the correlation matrix to be displayed.


In the "System Correlation" control, you can quickly check the systems that are highly correlated and those who aren't and then pick a smaller set of trading systems to combine using the meta-strategy tool.

Note that you can display the daily, weekly, monthly or yearly equity correlation. You can do so by updating the "Correlation of Returns" field at the bottom.
Real-Time Quote Sheets with QuantShare

$
0
0
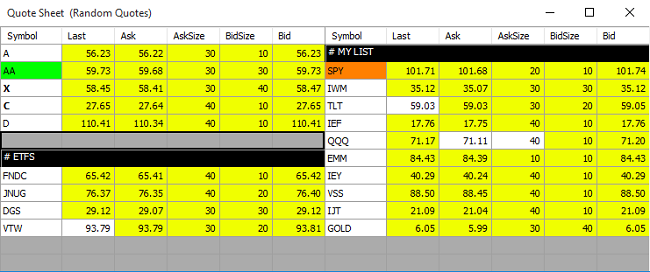
Unlike the Grid tool that can be used to create advanced real-time tables (such as a real-time correlation matrix), the Quote sheet is a very easy to use tool that displays real time data for the securities you want to track.

As with the Grid tool, the Quote sheet tool is available only in the real-time premium version of QuantShare.

Open a new quote sheet by selecting "Tools" from the menu then "Quote Sheet".

This will create an empty quote sheet.

All you have to do now is type the ticker symbol under the "Symbol" column to display the last, net, ask, bid... data in real time for that security.
The default data provider will be used to retrieve real time data. Click here for the list of data providers we currently support.

In the top of that list, we also support Bloomberg, Stockwatch and any data feed that supports Excel DDE or RTD technologies.

To change the default data provider, right click on the quote sheet, select "Settings", click on "Settings" tab then change the "Data Feed" field.
If you have multiple data feeds, you can open different quote sheets and each one could use a different feed.
Unlike the grid tool where each cell can have its own data feed, all cells in a single quote sheet must be associated to only one data feed.


Quote Sheet Settings

Right click on the quote sheet then select "Settings" to open the settings control.

Columns Tab:

Here you can define the fields you want to add to your quote sheet. To do so, simply select a field then click on the "+" button at the top.
You can organize the added fields by clicking on the up and down arrows.

Please note that some fields are available for a particular data feed while other not.
For example, the Implied volatility, VWAP, Option call open interest, last yield... fields are available only when using Interactive Brokers as data feed.


Settings Tab:

In the "Settings" tab, you can define the quote sheet title, data feed, background color, price change color, font color, text size and divider color.

If you want to specify default settings for any new quote sheet you plan to open in future, just define your settings then click on the "Save As Default" at the bottom of the quote sheet settings control.


Quote Sheet Layout

If you have selected to display 5 columns in your quote sheet, then these columns will be repeated if you increase the quote sheet form width. This will allow you to have two, three or more "Symbol" columns and thus the ability to display more data horizontally.

Also it is important to note that the quote sheets can be docked in the main QuantShare form. All you have to do is keep pressing on the ALT key and start moving the quote sheet form. You will then see several points where you can dock the form.


Import & Export Data

To export quote sheet data to CSV format for use with Excel or any other program, right click on the quote sheet then select "Export Data".

If you want to follow multiple ticker symbols and don't want to enter them manually in the quote sheet, copy all these symbols in a text file (one symbol per line) then right click on the quote sheet and select "Import/.... Symbols".

You can also drag and drop symbols from one quote sheet to another to copy them. Hold the CONTROL key then drag and drop to copy a symbol within the same quote sheet.


Sorting Data

In the quote sheet, you have the ability to sort the data by any column by first enabling the sorting feature (Right click then click on "Enable Sorting").
Once done, click on any column to start sorting the data. The data is sorted in real time. This means that if you sort the data by the ask price, the security with the highest ask price will always be displayed first/last.

Also note that each time you add an empty line or a divider, a new group of stocks is created. Each group of stocks is sorted separately.

How to use QuantShare Indicators in the Grid Tool

$
0
0
In a previous post, we have introduced the grid tool and how you can use it to create real time sheets. Today, we are going to show you how to use QuantShare functions and indicators and apply them to particular cells.


We are going to show you how to create and calculate in real time the relative strength index of a particular stock.

- Select "Tools -> Grid -> Grid Editor".
- Select the first cell "A1" then type a ticker symbol. Example: GOOG
- Click on the second cell "B1" then in the above tool bar, click on the "Formulas" button

A new control will open where you can add QuantShare language as well as C# formulas.

For this example, we will need to create a QS language formula, so let us click on the "Add formula" button at the top.

Let us name that function by typing a name next to the "Name" field. Call this function "rsi".
Below that field, click on the combo box next to "Data Used" and select "Realtime" as we want to calculate the real time value of the relative strength index.
In the formula editor on the right, type the following formula:
cell = Rsi(2);

This simple formula will calculate the 2-bar relative strength index then return the result to the cell.

Please note that you can add indicators by clicking on the "Add Indicator" button and you can also display the available functions/methods by using CONTROL+SPACE hotkey.

By default, each QS formula in the Grid tool has two parameters by default which are the ticker symbol name and the time frame. You can add additional parameters by click on the "Add Variable/Parameter" button.
Later, we can access that formula within a particular cell by calling this function:
=Formula.rsi("GOOG", 60)

This will execute the "rsi" function we just created while passing "GOOG" as ticker symbol and 60 (1-minute) as time frame.

Click on the "Compile" button at the top then close the form.

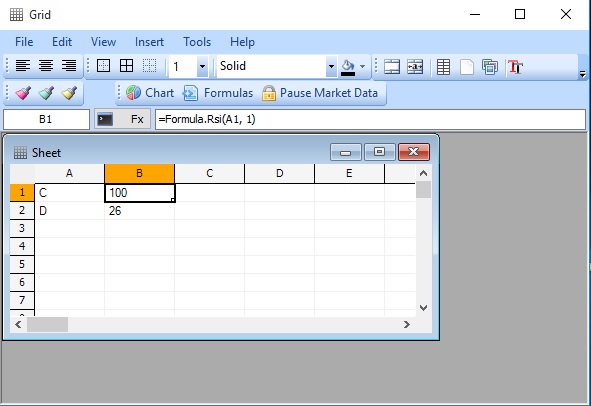
- Select the second cell again "B1" then type in the above formula editor (next to "Fx" button)
=Formula.rsi(A1, 60)


Note how we replaced "GOOG" by A1. This means that the function will use the value that is returned by the A1 cell as first parameter. If you change the ticker symbol in A1, the formula in B1 will be automatically updated.

The final step would be now to select a data feed for our cells. Select both cells, right click then select "Data Feed" then your data feed.

To save this grid, click on "File" then "Save".

You can open that grid directly in QuantShare by selecting "Tools -> Grid -> Open Grid" in the QuantShare menu then selecting the grid you just saved.

How to Adjust the Time Displayed in your Intraday Charts

$
0
0
Depending on whether you want to adjust time for real time data or historical intraday data, the procedure is totally different.

The historical data is downloaded from a specific source and the data is stored with the source time. If you are downloading intraday data from Yahoo, Google or any other data provider, the only way to change the bar's time is to edit the downloader and update the pre or post-script.

Let me show you an example:
- If you don't have the "Intraday Data for US Stocks" downloader then please download it from here: 733
- Select "Download -> Download Manager" then select "Intraday Data for US Stocks"
- Click on "Update" at the top of the download manager
- Click on "Parser" button in the first row then on "OK" and "Next"
- Click on "Next" again to see the bars date/time

Now, let us suppose we want to increase the time by two hours.

- Back the "CSV Settings" page (click on "Back"), click on "Post Script" button then add the following script:

for(int i=0;i < Data.Rows.Length;i++)
{
Data.Rows[i].Date = Data.Rows[i].Date.AddHours(2);
}


- Click on "OK" then "Next". The time is not updated on this screen (because at that moment, post script is not executed yet)
- Click on "Next" again then on "Show Output".


In real time mode, the time is also specified by the data source but can be changed on fly using exchange settings.

First, at the bottom of the chart, click on "Not live" at the bottom/left corner (in case the chart is not in live mode) then select a data feed (premium version only).
Click on the circle at the bottom/right corner then on "Exchange Settings".


If no exchange is specified for your ticker symbol, then "Default" exchange will be selected. You can check your symbol Market/Exchange by selecting "Symbol -> Update Symbol". If that Market/Exchange is not available in the list, then you will need to add it here "Symbol -> Categories".

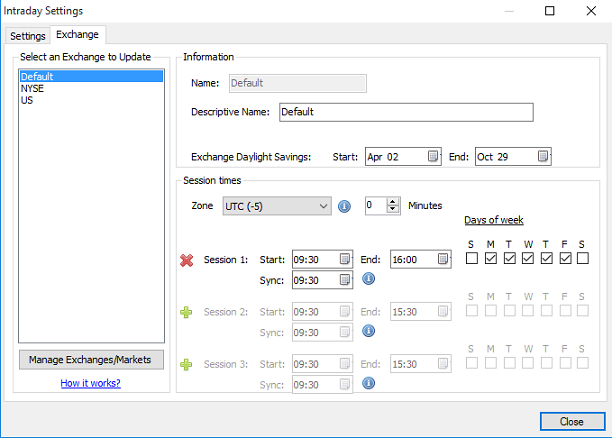
In the "Exchange" tab, you can define the exchange daylight saving, the time zone, the session time start and the sync time (which is usually the same as the time start).
The sync time is the time that is used as a reference to build bars.

For example:
If you are displaying an hourly chart and the sync time is 9:30 then the bars will have the following timestamps: ...8:30, 9:30, 10:30...
If the sync time is 9:00 then the bars will have the following timestamps: ...8:00, 9:00, 10:00...

In order to change the bars' time, you will need to modify the "Zone" field. Set it to the appropriate value then click on "Close".

Introduction to the Events Monitor Tool

$
0
0
The "Events Monitor" is a new tool recently introducted in QuantShare. It allows you to monitor and catch different QuantShare events and generate alerts, execute scripts, send emails... based on these events.

Currently we support the following events:
Symbol: Generated when a change happens to a ticker symbol (new data, information, new drawing...)
NewTick: Generated on a new real time tick
NewBar: Generated on a new real time bar
MarketDepth: Generated when market depth changes for the analyzed security
OrderStatus: Generated when an order status changes
Alert: Generated when a new alert is triggered

Note: All events except the first one are supported only in the real time version of QuantShare.

More events will be added in newer versions. Please also note that you can use the script editor (Tools -> Script Editor) to create custom events. We will discuss how to do that in the end of this article.


How to Monitor Events

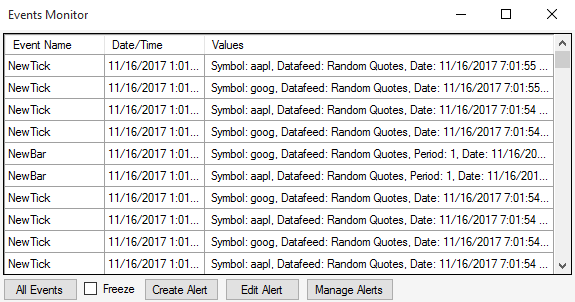
To start monitoring events, select "Tools" then "Events Monitor". This will bring a new form where you can select the events to display by clicking on the "All Events" button at the bottom. By default, all the events are displayed.

At any moment, you can check the "Freeze" check box to stop updating the list.

Each event comes with some attributes that are displayed in the "Values" column. The content or value of each attribute is displayed only if it is a numeric or text value. You will see something like "String[]" if the value is an array. In that case, you can access the different elements of the array using the Global script. More about this later in this article.


How to Create an Alert based on an Event

To create an alert for a specific event, click on the the "Create Alert" button at the bottom of the "Events Monitor" form.

Name: Type here the name of the event
Conditions: Specify the conditions that must be meet in order to trigger the Alert.
All conditions must be met in order to trigger the alert.
For each condition, you must first specify the event name, the field or attribute to check (You can see the different attributes in the "Events Monitor" under the "Values" column), the operation (Contains or equals to) and then the "Value" that must be checked.
Happens within...: Specify the maximum number of seconds that separate the first and the last condition
Notification: Select here how you want to be notified when the alert is triggered
General Event: This allows you to generate a custom event when the alert is triggered

As an example, in order to create an alert when you draw something on the GOOG chart, you need to create two conditions:

Condition 1
Event Name: Symbol
Field: symbols
Operation: Contains
Value: GOOG

Condition 2
Event Name: Symbol
Field: type
Operation: Equals to
Value: Drawing


Using the Script Editor to Catch Events

Open "Tools -> Script Editor" to create a global script. The global script allows you to control almost everything in QuantShare. When it comes to events, you can access the following two functions:

Order.SendEvent: Send a custom event
Order.SubscribeEvent: Subscribe to an event


Example 1:
// Generates a new event called "Hello" that has two attributes (Type and Value).
Hashtable h = new Hashtable();
h.Add("Type", "message");
h.Add("Value", 1);
Global.SendEvent("Hello", h);


Example 2:
// Display the message "Test" when the event "Hello" is received
Global.SubscribeEvent("Hello", Receive);

while(true) // Keep the script alive so that we can catch the "Hello" event
{
App.Main.Sleep(1000);
}

#functions#
public void Receive(EventManager m, SubscribeThreadEventArgs e)
{
MessageBox.Show("Test");
}


To test the above examples, create two scripts with the code in the example one and two then select the "Example 2" script, select "Settings -> Add current script to bookmark panel".
Execute the script from the bookmark panel then select "Example 1" and execute it directly from the script editor by clicking on the "Execute" button in the toolbar.

More information about the bookmark panel can be found here.

Note that you can access the event attributes using the "e" variable of type SubsribeThreadEventArgs.
That variable contains the following methods and properties:
e.Event.GetElements()
e.Event.GetNumeric(string attribute)
e.Event.GetValue(string attribute)
e.Event.Name
e.Event.Timestamp


10 New Ways to Download Historical Stock Quotes for Free

$
0
0
Few years ago, we created a post that lists several websites where you can download historical stock quotes for free. Since then, several of these data providers changed their download URL or simply stopped providing the data.
Here is an updated list of ten new websites that allow you to download free historical data for U.S. stocks.


AlphaVantage
AlphaVantage is a leading provider of free APIs for historical and real time data on stocks, physical and crypto currencies,.
All you have to do is register to get your free API then take a look at their documentation:
https://www.alphavantage.co/documentation/

To export historical daily quotes, here is the URL that you need to request:
https://www.alphavantage.co/query?function=TIME_SERIES_DAILY&symbol=[SYMBOL NAME]
&apikey=[API KEY]

You can use QuantShare to download real time historical and intraday data using the Alphavantage downloaders:
Intraday Historical Data - Alphavantage
Daily Historical Data - Alphavantage


Financial Content
Financial content is a very popular data provider that is used by several websites and companies. Here is the URL to get historical data
http://markets.financialcontent.com/stocks/action/gethistoricaldata?Month=12
&Symbol=[SYMBOL NAME]&Range=300&Year=2017


Tiingo
Tiingo is another data provider that allows you to download historical daily data free using their API.
Documentation can be found here:
https://api.tiingo.com/docs/tiingo/daily#Software

And here is the API call format to retreive EOD data:
https://api.tiingo.com/tiingo/daily/[SYMBOL NAME]/prices?startDate=2012-1-1
&endDate=2016-1-1


Quotemedia
Quotemedia is a leading provider of financial data. It provides EOD data for US and Canadian securities via this link:
http://app.quotemedia.com/quotetools/getHistoryDownload.csv?&webmasterId=501&startDay=1&startMonth=1&startYear=1900&endDay=17&endMonth=5
&endYear=2017&isRanged=true&symbol=[SYMBOL NAME]


Investopedia
The popular world's leading source of financial content, Investopedia, also provides historical data. You can get EOD data via this link:
https://www.investopedia.com/markets/api/partial/historical/?Symbol=[SYMBOL NAME]&Type=
Historical+Prices&Timeframe=Daily&StartDate=Nov+28%2C+2017&EndDate=Dec+05%2C+2017


Macrotrends
Macrotrends is a research platform for long term investors. Via their website, they allow exporting data for several series including U.S. securities.
Here is the URL to get this data:
http://download.macrotrends.net/assets/php/stock_data_export.php?t=[SYMBOL NAME]


Wall Street Journal
The Wall Street Journal or WSJ website provides an online corverage of breaking news and current headlines from the United States and around the world.
Here is the URL to export data from the WSJ website:
http://quotes.wsj.com/[SYMBOL NAME]/historical-prices/download?MOD_VIEW=page
&num_rows=6299.041666666667&range_days=6299.041666666667&startDate=09/06/2000
&endDate=12/05/2017


Nasdaq Website
The Nasdaq official website allows you to download data for U.S. securities.
To download data for APAM, browse the following URL then click on the "Download" link at the bottom:
http://www.nasdaq.com/symbol/apam/historical

The download cannot be easily automated but here at QuantShare we have a downloader for this.
You can get it here:
Historical Quotes from Nasdaq Website


Yahoo Finance
There has been a lot of discussion about Finance Yahoo recently and how they changed their URL to prevent automatic data download.
You can now download data manually from Yahoo.
Example:
https://finance.yahoo.com/quote/IWM/history?p=IWM
Then click on the "Download Data" link.

Or you can use the following QuantShare downloader to get data automatically from Yahoo servers:
Historical Stock Market Data


Stooq
Stooq is a Poland based company and a financial portal.
Data download cannot be automated, however you don't have to do that since all you need is download the entire database via a simple link.
Databases can be found here:
https://stooq.com/db/h/

You can download data in CSV or Metastock format for several markets including U.S stocks, U.K stocks, bonds, commodities, currencies, indices, macroeconomy data...
Data is available in daily, hourly and 5 minutes format.

Lock, Link and Undock your Charts

$
0
0
These are three features you can use on QuantShare to help you get the most out of your charts.
In the following article, we are going to explain you each feature and how to apply it to your charts.


How to Lock a Chart

This feature offers you the ability to lock a chart to a specific symbol. All you have to do is select a symbol from the "Select a symbol" combo-box at the top then click on the "S" link at the bottom of the chart you want to lock.

After the new menu opens, click on "Lock Chart" and the "S" link will become "L" with a dark background. This tells you that the current chart is locked.

Once a chart is locked, it will stick to that symbol no matter which symbol you select.
Note that by default, all charts are updated automatically to the ticker symbol you select.


How to Link a Chart

You can link charts by symbol or by time-frame. To link a chart by symbol, click on the "S" link at the bottom of the chart then select a link color. Do the same to all the charts you want to be linked together (have the same link color).

All charts with the same link color are linked and thus each time you select one of these charts then update the active symbol, only these linked charts will be updated (Symbol Link).

To link a chart by a time-frame, click on the "T" link at the bottom of the chart then select a link color.
If the charts are time-frame linked then they each time you update the time-frame of one of these linked chart, all other charts with the same link color will be updated with the same time frame.

Note that by default, changing the time frame or period of a chart does not change any other charts time frame.


How to Undock a Chart

By undocking a chart, you allow it to move outside the boundaries of QuantShare main form. The undocked chart will no longer be part of the main application form. This will allow you for example to make that chart visible while hiding (minimizing) the main application form.

To undock a chart, right click on it then select "Windows Type" then "Floating Window".

By default, a chart is in the "MDI Window" state. Changing it to the "Owned Window" type will allow you to move that chart outside the boundaries of the main form. However, unlike the "Floating Window" type, the chart will still belong to the main form.

//quantshare2.rssing.com/chan-8618066/article88-live.html


//quantshare2.rssing.com/chan-8618066/article89-live.html

//quantshare2.rssing.com/chan-8618066/article90-live.html

//quantshare2.rssing.com/chan-8618066/article91-live.html

QuantShare Trading Software: New Features in the 3.4.0 Version

$
0
0
Here is an introduction to the new features we recently released.

For all changes, please visit the following link.


Meta-Strategy Simulator

The new meta-strategies tool allows you to combine several trading systems and see how they would have performed if you invested a specific percent of your capital in each one.

To open the meta-strategies tool, select "Analysis -> Meta-Strategy Simulator"

Like the trading system simulator tool, click on "New" to create a new meta-strategy. In the main panel, (Meta-Strategy), you can add there the trading systems you have previously created and that you would like to combine.

Click on "Add/Remove Trading Systems", check the trading systems that you want to include then click on "Load Checked Item(s)".

Now, that your systems are added. Here are few important settings you need to know about:

Relative Weight: This weight is compared to other trading system weights and is used to calculate the percentage of capital to invest in the strategy

Example:
System1: Weight = 1
System2: Weight = 2
Total Weight = 1 + 2 = 3

System1 will get 33% (1 / 3)
System2 will get 66% (2 / 3)

Note: You can optimize the weight of each strategy by typing for example: 5;10 (Optimize the meta-strategy with two different weights "5 and 10")

Rebalance Frequency: This allows you to specify when to rebalance each strategy. Given the previous example, if the System2 weight becomes 69% and a rebalance occurs then 3% of the strategy will be sold so that the new weight would become equal to 66%.

Backtest individual strategies: This option forces the backtest of each individual strategy before backtesting the meta-strategy.

Optimize strategies selection: This option allows you to optimize your meta-strategy by combining different trading systems. You can also specify the maximum number of trading systems to include in each optimization.

The meta-strategy engine will trade the different strategies equity curves (not individual assets traded by each strategy).
Note that when you run the meta-strategy, a ticker symbol for each individual trading system will be created in your database. The ticker name has the following format: ~[TRADING SYSTEM NAME]

Example:
If you add 5 strategies and run the simulator, then 20% of your capital will be invested in each strategy (assuming same relative weight values).
If you selected a monthly rebalancing then each portfolio will be rebalanced at the end of each month. If at the end of the month, a given strategy represents say 23% of your total capital then the meta-strategy tool will adjust the strategy weight and invest 20% in it.


Note 1:
When creating a meta-strategy, you can also define a formula and assign a money management script to it.

Just consider that instead of individual assets, the formula and money management scripts will be applied to equity curves.

If you add for example the following formula:

buy = perf(close, 10) > 0;
sell = perf(close, 10) < 0;


Then your meta-strategy will invest only in the trading systems that had a positive return in the last 10 trading bars. If the last 10-trading bars return is negative then any "opened" strategy will be closed.

Note 2:
The difference between the meta-strategy tool and the combine trading system tool (You can find it in the simulator manager, under "Tools -> Combine trading systems") is that this new tool is a much more advanced one and will allow you to backtest and optimize any kind of meta-strategy you can imagine.


Charts List

The new charts list control displays all open charts in a table. You can use it to easily switch between your different charts.

To open this control, select "View -> Charts List".

The control has the following columns:
Symbol: This is the chart's ticker symbol
Name: This is the full name of the chart's symbol
Timeframe: This is the chart's time frame (Example: 1m, daily, monthly...)
Comments: This is where you can add a comment for each chart. That comment will be saved and will be available as long as the chart is open.

You can hide any column by right clicking on the table then un-checking the appropriate field.


OnTimer Event

The "OnTimer" event is a new AMM event that you can use when creating automated strategies.

- To create an automated strategy, select "Portfolio -> Portfolio"
- Click on "New" to create a new portfolio
- Check "Automated Trading System" then click on "Next"
- Create or add an existing trading system
- In the new trading system, select the "Money Management" tab then click on "Add a new money management script"
- At the top, select "ATS" then click on the "OnStart" event

There, you can create one or several timers that will be executed given the settings you specify.

Example:
Functions.AddTimer("MyTimer1", 13, 59, 0, 0);

The above instruction creates a new timer that will be executed at 13:59:00 (Your computer time)
The last parameter (0) means that the timer will be executed only once. If you want to execute the timer event every minute then replace that value with 60.

- Now, select the "OnTimer" event and add your code there

Example:
if(Timer.Name == "MyTimer1")
{
// Do something. Close positions, add log...
}


Equity/Bucket Analysis

In the trading system report that appears after you backtest or optimize a strategy, select "Analysis" tab.

"Equity Analysis" tab:

Here you can create a filter formula to be applied to the trading system's equity line.
The "close" variable refers to the equity line time-series.

Example:
filter = perf(close, 1);
spy = getseries("spy", close);
AddColumn("SPY", perf(spy, 1));


The above formula will first calculate the equity line 1-bar return and display it.
It will add then a new column that displays the 1-bar return of the SPY (S&P 500 ETF) for each trading bar.

You can then check the one-bar return of your strategy and compare it with the SPY benchmark.

"Equity Bucket Analysis" tab:

This tool will create several buckets based on a benchmark symbol. Each bucket will display the average 1-bar return of your strategy's equity line.

Example:
Benchmark Symbol: SPY
Number of Buckets: 10

Min/Max Return Interval: -10/-1
Average Return: -2
Count: 275
Average Equity Return: -1.5

This means that during the analyzed period (trading system start/end dates), the SPY 1-bar return was 275 times between -10% and -1%.
The average return of the SPY in these 275 instances was -2%
At the same time, your strategy 1-bar return average were equal to -1.5%


Protect Your Trading Systems

With this new version, you can now password-protect your trading systems.

To do so:
- Click on the "Manage" button at the top in the simulator manager
- Select your trading system
- In the top bar, click on the "+" icon (in case it is there - to add more options)
- Select "Tools -> Encrypt Checked Items"
- Type your password

Your trading system as well as any money management script attached to it will be encrypted using the TripleDES encryption.


Interactive Brokers

We have completely re-written the IB plug-in and improved the performance/stability of that plug-in.
The new version of the Interactive Brokers also supports 64bit operating systems unlike the previous one.

More info on how to connect IB to QuantShare:
http://www.quantshare.com/index.php?option=connections&cid=413

How to Scan for Parallel Resistance and Support Lines

$
0
0
Support and resistance levels are not supposed to be impenetrable barriers offering a risk free buy at the support threshold and sell at the resistance threshold. Traders and investors should see these resistance/support as psychological levels, concentration of supply and demand and places on the chart where a reversal may occur for the underlying security.

In this article we will show you how to create a watchlist that would scan for parallel resistance and support lines.

First, let us create a dynamic watchlist.

- Select "Tools -> Watchlist"
- Click on "Create" in the Watchlist form
- Click on "Create a dynamic watchlist"
- Select the securities to include in the watchlist then click on "Next"
- Type the following formula then click on "Finish" to save your watchlist

p = 250;
s = autosr(0, 0, p);
r = autosr(1, 0, p);
d = absolute(s - r) / absolute(s[p] - r[p]);
filter = d < 1.1 and d > 0.9 and close > 5;


Let us know go through the formula and explain how it works.

The first line creates a new variable "p" and associates it with the 250 value. This would be the period to use to find our support and resistance. You can update this value later if you want to find other short, medium or longer-term supports and resistances.

The second line uses the "autosr" function to automatically calculate the 250-bar support.
The third line uses the "autosr" function to automatically calculate the 250-bar resistance.

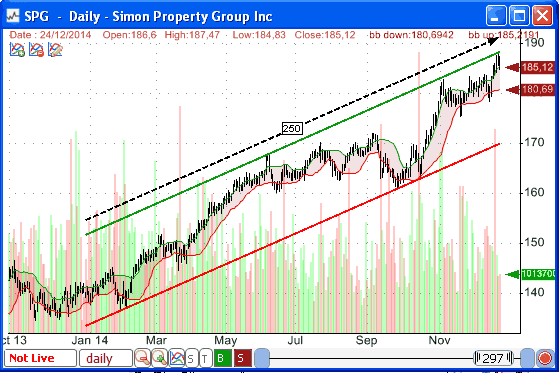
The "autosr" function is a unique QuantShare indicator that calculates automatic supports and resistances based on the data prices. You can use the auto-support and resistance as a drawing tool by selecting the "Auto Support/Resistance" icon in the drawing tools list (on the right bar).


You can learn more about this function by reading the following blog posts:
Detect chart patterns using the auto support/resistance indicator
Backtesting chart patterns using the auto support and resistance indicator

Once the last support and resistance are calculated, we measure the ratio of the support/resistance spread/distance on the last date to the first date (250 bars ago). This is done in the fourth line of the above formula.

The actual filtering/scanning occurs in the fifth line. The "filter" variable must be higher than 0 in order for the watchlist to include a specific security.
In the filter rule we check for the previously calculated ratio to be between 0.9 and 1.1. This would allow us to scan for stocks with almost parallel resistance and support lines.

In addition to the above rules, we have also added a price rule that would prevent us from displaying securities with a price below $5.

You can find a ready to use watchlist to scan for parallel resistance and support lines here: 1604

Note: In some rare cases, when you use the Auto Support/Resistance drawing tool and add it to the past 250 bars, you may find out that the lines are not parallel. This is because the drawing tool has an additional setting that allows you to specify the number of bars to skip around the high/low (Right click on one of the lines, select "Settings" then "Trendlines" tab).

If that value is say 4, then the algorithm would ignore the four bars next to the high/low and would not use these bars as a second point to build the support or the resistance.

QuantShare Trading Software: New Features in the 3.4.1 Version

$
0
0
One of the main new features of the new 3.4.1 version of QuantShare is the new Quote Sheet tool for the real time version.

Below a brief description of some of the different features we have added to this new version.


Quote Sheet Tool

You can create a new quote sheet by selecting "Tools -> Quote Sheet".

We have created this tool to make it easy to display real time data from your data provider. All you have to do is type the security ticker name under the "Symbol" columns.
Note that if you expand the quote sheet control, more columns will be added.

By right clicking on the quote sheet you would be able to do many things such as enabling sorting (click on a column header to start the auto-sorting feature), inserting a divider, changing the row color... and updating the displayed columns.

To display more columns in your quote sheet, right click on the quote sheet then select "Settings". In the "Column" tab, you can add for example a column to display the day's high, day's low, bid, ask, sector, industry...
Note that some fields such as the OptionCallOpenInt, Lastyield, TradeCount... are available only when Interactive Brokers is selected as data feed.

One more important thing to know is that each quote sheet should be associated with a data provider. You can have different quote sheets where each one displays data from a different data provider.

To update the data provider associated with a quote sheet, select the "Settings" column in the "Settings" control we opened previously. Next to "Data Feed", select your data provider. Only connected data providers are displayed there.


Trading System Report

If you still don't know how to create and backtest a trading system, we highly recommend you begin by reading this blog post:
The Ultimate Guide to Create Trading Systems in QuantShare

In the trading system report that appears once a backtest is completed, select "Report Settings" tab then click on "Generate HTML Report". This will generate and display an html report for your trading system.

In case you want to update the report look, open your QuantShare folder (it is usually c:\program files\ctrading\quantshare) and edit the "tstemplate.html" file.
The QuantShare report tool uses that file as a template to create the html report. All it does is update the different tags with the appropriate system result information.
As an example, it replaces the following tag ({{EquityChart}}) with the equity chart html tag.


Scale in-out Signals on Charts

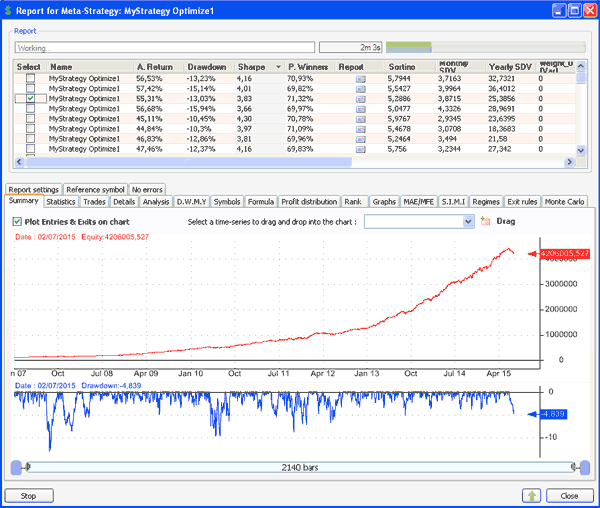
You probably know how to display your trading system's signals (buy, sell, short and cover signals) on a chart but in case you don't, all you have to do is click on the "Plot Entries & Exists on chart" check box in the trading system report form.

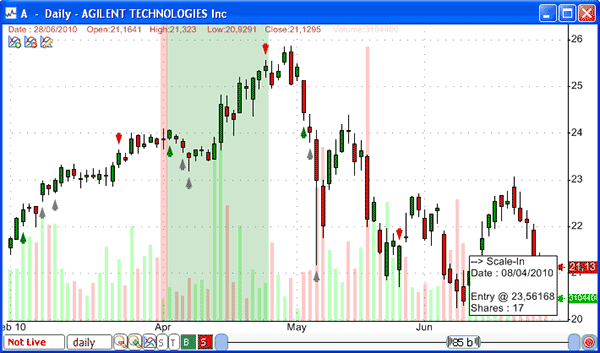
In this new version, the scale-in and scale-out entries and exits will be displayed as well on your chart (Gray arrows). Of course you will be able to click on these arrows to display the number of shares bought or sold as well as the entry/exit price.


Recent Orders

To open the "Recent Orders" control, select "Portfolio" then "Recent Orders". The control will display all the recent orders you have taken manually or automatically using your automated trading systems, charts or entry orders forms.

Note that this control is available only in the real time version.

How to Create Your First Meta-Strategy

$
0
0
The meta-strategy tool is a new powerful QuantShare tool introduced few months ago. Simply put, a meta-strategy is a trading system that trades multiple trading systems.

The ability to combine, backtest and optimize several trading systems and turn them into a single one is the main purpose of the tool. You will be able to add as many trading systems as you want, set a different weight for each one, trade different strategies equity curves as they were assets, create advanced money management scripts for your meta-strategy and so on.


Let us get started now by creating our first meta-strategy. Obviously, the first thing you need is to have a set of different trading systems that we will use in our new global system.

If you are new to QuantShare and still don't know how to create a trading system then I highly recommend you take a look at the following blog post:
The Ultimate Guide to Create Trading Systems in QuantShare


Introduction

Select "Analysis" then "Meta-Strategy Simulator". The simulator control is similar to the trading system simulator (Analysis -> Simulator).
Click on "New" at the top to open the meta-strategy editor. The first tab (Meta-Strategy) is the most important one and there you can specify all the important meta-strategy settings.

First, click on "Add/Remove Trading Systems". To select multiple systems, just check each system that you want to include. Click on "Load Checked Item(s)" once done.


Relative Weight

Each strategy will have its own row. The second column (Relative Weight) is editable and there is where you can set up the relative weight of each strategy.

Example:

Say we have added 3 trading systems:

St1
St2
St3


If you keep the default relative weight for each strategy then our meta-strategy will be invested approximately 33% in each system.

Now say we update the relative weight and put these values:

St1 => 0
St2 => 1
St3 => 4


The first system "St1" will be ignored.
The calculation of the percentage to invest in each strategy is done as follow:
The application sums the different weights (0 + 1 + 4 = 5) then invest the following percentage in each one (Weight / Total).

St1 => (0 / 5) = 0%
St2 => (1 / 5) = 20%
St3 => (1 / 5) = 80%


Rebalance Frequency

Under the trading systems grid, you can select the rebalance frequency. If you select a Monthly rebalance frequency then the meta-strategy will adjust the amount to invest in each strategy on monthly basis so that it meets again the initial weights.

Back to your previous example:

St2 => 20%
St3 => 80%


If after few days, the system "St2" return increases while "St2" return decreases, we may end up with something like this:

St2 => 22%
St3 => 78%


On the rebalance day, the meta-strategy will sell some equity (scale-out positions) of the "St2" system and buy some equity (scale-in positions) of the "St1" system so that the new weights become approximately:

St2 => 20%
St3 => 80%


Optimization

One of the most exciting features of the meta-strategy simulator is the ability to test different trading system combinations.
If you have 10 trading systems and would like to check which combination of four systems would perform best then all you have to do is add these systems in your meta-strategy, check "Optimize Strategies Selection" at the bottom, select the number of trading systems or strategies to include then optimize your meta-strategy.

You may also want to have a fixed number of trading systems then optimize the remaining ones. To do this, check the "Optimize Strategies Selection" option then check the trading systems that you always want to invest in. These checked systems will not be included in the optimization and will always be invested in your meta-strategy.

Besides optimizing strategies selection, you can also optimize the relative weight of each of your systems. To do this, simply add two or more relative weight numbers separated by a semi-colon.

Example:

St1 => 1;2;3
St2 => 1


The above example would perform three backtests if optimized.

Backtest 1:
St1 => 1 (50%)
St2 => 1 (50%)

Backtest 2:
St1 => 2 (67%)
St2 => 1 (33%)

Backtest 3:
St1 => 3 (75%)
St2 => 1 (25%)


Meta-Strategy Rules

Click on the "Strategy" tab at the top. There, you will find a formula editor such as the one you are using when creating single trading systems.

Implementing buy/sell/short/cover rules for a meta-strategy is considered advanced stuff and is not mandatory.
By default, the meta-strategy will invest in every strategy given the relative weights you previously specified. This is why the default rule is:

buy = 1;

There is no sell rule since by default you are invested all the time in each strategy.

Now, if you want to trade based on the system equity curve and invest selectively in your trading systems, you can define here your own buy and sell rules.

Here is a very simple example:

buy = perf(close, 10) > 0;
sell = perf(close, 10) < 0;


// Invest in a trading system only if its 10-bar return is positive and sell all positions of that trading system if its 10-bar return becomes negative.

If you want even more advanced stuff, you can create your own money management script for the meta-strategy.

There is just one important thing to keep in mind. When dealing with the meta-strategy, just substitute securities with trading systems. A security close price becomes a trading system equity curve. That is the most important thing to know.


6 New Ways to Download Free Intraday Data for the U.S. Stock Market

$
0
0
Recently we updated our very popular blog post about different ways to download free EOD data. We removed the data sources that are no longer working and added new ones.

Today we decided to do the same to the old list of free intraday data providers, so here is the updated list:


Google Finance

Google Finance is one of the intraday data source that was listed in the previous article.

In order to download data, you need to use the following URL:
The URL format is: https://www.google.com/finance/getprices?i=[PERIOD]&p=[DAYS]d&f=d,o,h,l,c,v&df=cpct&q=[TICKER]

[PERIOD]: Interval or frequency in seconds (60 means 1-min)
[DAYS]: Historical data period, where "10d" means that we need historical stock prices data for the past 10 days.
[TICKER]:Ticker symbol of the stock

Here is an example:
https://www.google.com/finance/getprices?i=60&p=10d&f=d,o,h,l,c,v&df=cpct&q=GOOG

Note that the data is available for several countries. You can find the full list here:
https://www.google.com/intl/en_ca/googlefinance/disclaimer/?sa=X&ved=0ahUKEwiSt8DTkaTcAhVs6IMKHbDXD2oQ1AEIUg

You can get data in QuantShare using the following downloader: Intraday Data for US Stocks


Yahoo Finance

Yahoo was also listed in the previous article and it is one of most used data sources for stock data.
It allows you to download intraday data for several stock markets.
You can get data for about 62 exchanges, however, unlike the Google downloader which gets data for the past 10 days, the Yahoo one provides data only for past five days.

Symbol Lookup: https://finance.yahoo.com/q?s=&ql=1

You can get data in QuantShare using the following downloader: Intraday Quotes for Major Stock Exchanges


AlphaVantage

AlphaVantage is a new free API provider for historical, intraday and real time data on stocks.

In order to use their API, you need to register and get a free API key on their website.

Their documentation can be found here:
https://www.alphavantage.co/documentation/

Example of usage:
https://www.alphavantage.co/query?function=TIME_SERIES_INTRADAY&symbol=MSFT&interval=1min&apikey=demo

In the above example, MSFT (Microsoft) ticker symbol is used. You will also need to replace the apikey (demo) with your own key.

You can use QuantShare to download real time intraday data using the Alphavantage downloader:
Intraday Historical Data - Alphavantage


IEX

IEX (Investors Exchange) is a stock exchange based in the United States. It offers free real time, end-of-day and Intraday data.

You can easily download 1-min data without any API key by using the following URLs:
https://api.iextrading.com/1.0/stock/aapl/chart/date/20180629 (Data available for the past 30 calendar days).

To get the most recent day data (include real time updates):
https://api.iextrading.com/1.0/stock/aapl/chart/1d

Note that the new premium version of QuantShare supports the free IEX real time feed.


Finam

Finam is a Russian website that provides data for the stock, futures, ETF and Forex markets. The data is available for only very highlight capitalized securities, however for these securities you can download several months worth of tick data.

Here is how to download stock data:

- Use Google translate to translate this Russian website
- Browse the following URL: https://www.finam.ru/analysis/profile041CA00007/default.asp
- In the top form, select "U.S. Stocks (BATS)" then select a stock (Example: Exxon Mobil)
- Select the start/end dates and frequency (Example: 20.04.2012 -> 24.04.2012 and tick data)
- Click on the "Get the file" button to download stock data in CSV format


Stooq

Stooq is a company based on Poland offering a financial portal and the ability to display data for numerous securities.

Previously, Stooq was offering the ability to get 5-min data in CSV and Metastock format for all securities in a single file.
Unfortunately, that ability is no longer available. However, you can still get data per symbol by browsing a security URL:
https://stooq.com/q/a2/?s=^spx&i=1&t=c&a=lg&z=530&ft=201807101819&l=0&d=1&ch=0&f=0&lt=58&r=0&o=1 (Example for ^SPY)

Click on the "csv" button at the bottom to download the data.


Here is a table that summarizes these different free intraday data providers:


QuantShare Trading Software: New Features in the 3.6.0 Version

$
0
0
The following article introduces the new features implemented in version 3.6.0 of QuantShare.

In the comments section, at the bottom, please tell us which feature would you like to know more about.

Note that the first two features concern only the premium version.


Free Real Time Feed

Investors Exchange (IEX) is a stock exchange based in the United States. IEX provides free real time data to U.S. stocks as well as historical data for the past 30 days.
The new version of QuantShare has added the ability to connect and stream data free from the IEX Exchange real time feed.

Select "Accounts -> Connect" then select "IEX Exchange" to open the IEX feed.

You can check instructions here to find how to display real time charts, quote sheets, alerts...
Presentation of QuantShare's new Real Time Version
Create Realtime Quote Sheets with the Watchlist Tool
Real-Time Quote Sheets with QuantShare
Real Time Alerts: Support and Resistance Lines Breakout
How to Create a Custom Real-Time Table using QS Trading Software


Custom Real Time Feed

In this new release, we have added the ability to create your own custom real time feed using the script editor.

To open the custom real time feed, select "Accounts -> Connect" then custom feed.
You can check instructions above on how to create watchlists, charts and quote sheets using this real time feed.

The custom real time provider can be feed with data using the script editor.

The following is an example:
- Select "Tools" then "Script Editor"
- Select "File -> New" then type a new name for your script
- Type the following script to pass tick data to GOOG
RT.SendCustomFeedEvent("GOOG", DateTime.Now, 0, 200, 10);

The data passed is a trade of $200 with a volume of 10.

Here is the explanation of the different parameters:
1/ Ticker symbol
2/ Tick date and time
3/ Tick type (0 for a trade, 1 for an ask update and 2 for a bid update)
4/ Price
5/ Volume


Regime Tool

Some improvements have been done to the "Regime" tool. That tools allow you to quickly see the how your strategy performs under different market regimes.

You need to backtest a strategy first. After that click on the "Regimes" tab in the simulation report.
Set the market and volatility symbols. Example: SPY (S&P 500 ETF) for the market symbol.
Click on "Calculate" then select any market regime.
On the right panel, you will see the return of your strategy if it was invested only during that market regime.


DrawItem Function

DrawItem is a QS language function that allows you to get a drawing item value for each bar.
Let us say you draw a line and you want to create an indicator that returns true or 1 when the stock price is above that line.

Here is how to do that:
- Create an extended trend line for example
- Right click on it, select "Settings" and take note of its name
- In the formula editor (Right click on the chart then select "Edit Formula"), type the following formula:
a = close > DrawItem("643162", "Line"); // Assuming "643162" is the drawing item name
plot(a, "");


Note that you can also directly create an alert based on that line by right clicking on it then selecting "Create Alert".

The "DrawItem" function was implemented in a previous version of QuantShare. Previously it was working only when the drawing item is located in the first pane.
In the current version we added the ability to reference drawing data on any pane.

How to Create an Automated Trading System in QuantShare

$
0
0
In QuantShare, an automated trading system or ATS is a portfolio that can generate orders and submit them automatically to your broker based on specific rules defined in a
trading system.

In order to create an automated trading strategy, you will need to create a trading system. The trading system contains all the logic (buy/sell rules, money management...) behind
the ATS.

The following blog posts can help you get started with implementing and creating your own trading systems:

QuantShare Programming Language Tutorial
The Ultimate Guide to Create Trading Systems in QuantShare
How to build and backtest a robust stock trading system
Let me Show You How to Create Hundreds of Profitable Trading
Systems

How to Optimize a Trading System with Thousands of
Billions of Combinations


Once you have implemented/backtested your intraday trading system and are satisfied with the results. The next step would be to create an automated trading system (ATS) from this
system.

To do this:

- Select "Portfolio -> Portfolio" from the menu.


- Click on "New" to create a new portfolio
- Specify the starting capital then select the kind of portfolio you want to create.

Manual: A portfolio where you can send orders and add positions manually
End-Of-Day: A portfolio based on a trading system specifically designed for End-Of-Day data. You will be able to click on a button to generate signals then another button to send
orders to your broker.
Automated Trading System: A portfolio based on a trading system specifically designed for intraday data


- Select "Automated Trading System" then click on "Next"
- Click on "Add Trading System" then select the trading system you want to add to your ATS

Make sure that the number of symbols does not exceed the maximum number of streaming symbols allowed by your broker or data feed.

From the same form, you can update your trading system by clicking on "Click here to update" next to "Trading System".

- Click on "Next"

Here, we will define the time frame as well as the real-time data source.

If we select "10m" (10 minutes) as time-frame then our strategy buy/sell rules will be executed each time a new 10-min bar is formed.

If you want the strategy to execute on each tick, then all you have to do is select "Tick" as time frame.

Under the "Time frame", check "Real-time" then select the data source to get real time tick data to feed your ATS. This could be your broker feed (Interactive Brokers) or another
data feed (IEX, IQFeed, Barchart, Bloomberg, Reuters Xenith...).


Checking the "Analyze on each incoming tick" instructs QuantShare to execute the strategy buy/sell rules on each tick while at the same time working with the 10 minutes bar
series (example).

To give you an example, let us say our trading system formula is as follow:
buy = rsi(14) > 70;
sell = rsi(14) < 30;


RSI will be calculated based on the past fourteen 10-min bars. By checking "Analyze on each incoming tick". The formula will be analyzed on each incoming tick. The previous bars
will be the same, however the last bar (most recent one) will update on each incoming tick.
You can display these rules on a real time chart to have a visual confirmation of the changes.

Here is a brief description of the different options under the ATS Settings / Startup tabs:
Close positions when ATS is stopped: Instructs QuantShare to close any opened position when you stop your ATS
Maximum bars to load: This is the number of bars to load for each security when you start your ATS
Wait before starting AT: The number of seconds to wait before effectively running the ATS (After you click on the "Start" button). During this time, QuantShare can build bars and
backfill data.
Minimum bars: Minimum number of bars a security needs before your ATS can start trading that security
Force backfill at startup: Backfill every analyzed security when starting the ATS

- Click on "Next" to move to the last screen

Here we will define the broker that the ATS will use when submitting orders.

- Uncheck "Enable Simulated Mode" (otherwise, orders execution will be simulated using the real time data defined in the previous screen)
- Select the broker (Currently only Interactive Brokers is supported. IB must also be connected).

Note: If the "Enable Simulated Mode" is disabled, close the Portfolio form, select "Accounts -> Real time settings", select the "Trading" tab then uncheck "Simulated Trading".

- Click on "Finish" then name your automated trading system.

To start the ATS, click on the "Start Automated Strategy" at the top on the right panel.


Dynamic Position Sizing in your Trading System

$
0
0
In QuantShare, there are two ways to create dynamic position sizing strategies. The easiest method is using the QS programming language and the advanced one is using the money management tool. This article is about the former method.

If you are not familiar with the QS programming language, we strongly suggest you take a look at this article:
QuantShare Programming Language Tutorial

You also need to learn how to create trading strategies before continuing with this tutorial:
The Ultimate Guide to Create Trading Systems in QuantShare


Dynamic Position Sizing

By default, a trading system will allocate an equal amount to each position. The amount is calculated by taking the strategy equity and dividing it by the maximum number of allowed positions.

If you have 100,000 USD in your portfolio and you set up 5 as number of positions, then QuantShare will buy 20,000 USD worth of shares for the new position.


You can change this logic using a single line in your trading system QS language formula. All you need to do is use the "SetSimPosSize" function and define how you want QuantShare to invest in each new position.

The "SetSimPosSize" has two parameters:
Trade Size: Could be an amount in dollars or a percentage value depending on the second parameter
Position Size Type: The position sizing type or technique to use. Possible values are: _DollarValue, _PercentageOfEquity, _Shares


Simple example to buy a fix dollar amount ($10,000) for each new position:
SetSimPosSize(10000, _DollarValue);

To buy a fixed number of shares (Example: 10 shares) use:
SetSimPosSize(10, _Shares);

To buy 10% of the portfolio equity for each new position use:
SetSimPosSize(10, _PercentageOfEquity);

Of course you can use the QS language to create advanced position sizing techniques. For example, you can instruct QuantShare to buy 50% of equity for SPY and 10% for any other asset. Here is how:
pos = iff(stringequal(name(), "SPY"), 50, 10);
SetSimPosSize(pos, _PercentageOfEquity);


Money Management

For advanced position sizing techniques, you can use the money management tool. This tool allows you to implement C# based scripts that catch different trading events (OnStartSimualtion, OnEndPeriod, OnNewPosition...) and perform different actions such as: Increase the number of shares to be bought, scale-in/out a position...

Here are some examples of position sizing techniques implemented using the money management tool:
5 position sizing techniques you can use in your trading system

And here is how to create a scale-in trading strategy and optimize it (also using the money management script):
Money Management: Scale-in Trading Strategy
Money Management: Optimize the scale-in strategy

Compare Multiple Securities in a Single Chart

$
0
0
In any single chart, you can add tickers to compare performance between two or more assets.

To do so, right click on the chart, select "Edit Formula" then you can either type the formula directly or have the wizard tool write it for you. To do this, click on the "Add Indicator" button, select the "External Symbol" tab, type a ticker symbol, enable "Compare with current symbol" then click on "OK".
The above steps would plot a new OHLC graph on the top of the existing one.

In the previous screen, you also have the ability to plot a line instead of an OHLC chart by clicking on the "What to Show?" field and selecting "Close".

Do the above steps again to add another symbol to the chart and thus compare multiples securities at once.

If you do not want to compare the performance of these securities but rather display each graph using a different scale, click on the "Chart" icon at the bottom of the chart (near the "S" button) and select "Set Linear Scale".

Finally, if you want that the different securities use the same scale (Not very useful in comparing assets however), right click on the chart and select "Edit Formula".

In the new form toolbar, there is a left and a right button. These will show you the different formulas used by the chart.

NB: A chart can have one or multiple formulas. Different formulas is used simply to differentiate between the different indicators displayed on that chart. You can combine all formulas in a single one, that does not change the display.

Now, note that the function that will display the OHLC chart of the external symbol is "PlotCandleStick1". The last parameter of the function will allow you to specify style settings. All you have to do here is replace "StyleOwnScale" with "StyleSymbolNone".

NB: Once you put the cursor at the last parameter (or any other parameter position), use CONTROL+SPACE to display the list of available values for that parameter. This function could be very useful when writing QS language formulas.

If you want to learn more about QS language, please check the following blog post:

QuantShare Programming Language Tutorial
Viewing all 106 articles
Browse latest View live