Quantcast
Channel: QuantShare
Viewing all 106 articles
Browse latest View live

QuantShare Trading Software: New Features in the 3.7.0 Version

$
0
0
The following is a presentation of the new features that were implemented in the most recent version of QuantShare, the quantitative analysis tool.

Please let us know in the comments section below, which features do you want us to implement and if you have any questions about the newly added features.


Bookmark Tool

This tool allows you to create shortcuts for your favorite chart's position.
To open the bookmark tool, select "Tools" then "Bookmarks".

Let us say, you entered a trade on AAPLE on Jan 2019. To save this position as a bookmark, right click on the entry date on the chart and select "Add to Bookmarks". As you soon as you hit that button, a new entry will be added in the "Bookmarks" control.
Now, whenever you click on that entry in the Bookmarks control, the selected chart will load with the corresponding bookmark symbol, time frame and the chart will automatically move the bookmark date.

You can specify whether to display the bookmark date on the right or left of the chart by clicking on the "Settings" button at the bottom of the "Bookmarks" control.

Finally, you can organize your bookmarks by categories by simply adding new categories then dragging and dropping any bookmark into that category.


GetMarketProfileData Function

The new GetMarketProfileData function is an advanced C# new function that allows you to access profile data within your C# custom functions created using the "Tools -> Create Functions" tool.

Let us go through an example:
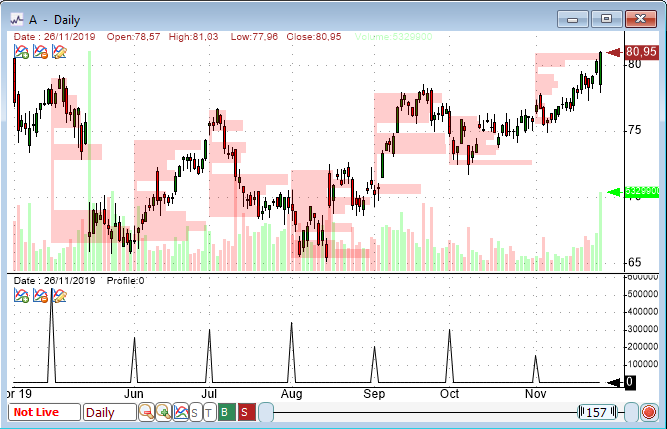
We have the following profile function in our chart (QS language):
PlotProfile("volume", month() != ref(month(), 1), 1, 10, colorRed, colorRed, OperationAvg);

This will plot the average volume profile each month.

Now, let us use our new "GetMarketProfileData" formula to get the average volume of the first bucket and display it on a chart.
We first need to use the "GetMarketProfileData" to calculate the profile, similar to what we have done with the QS language. This function returns a variable of "VectorProfile" type. This is the first line of the below C# code.
After that, we just need to loop through each bar, check when the profile data is not null (that would be the first of each month in this case).
Finally, we can access the first bucket value using the "BucketsY" property.

VectorProfile vp = cFunctions.GetMarketProfileData("volume", TA.Month() != TA.Ref(TA.Month(), 1), 1, 10, ProfileDataCalculation.Avg);
for(int i=0;i {
if(vp[i] != null)
{
result[i] = vp[i].BucketsY[0];
}
}


Quarterly Time Frame

In this new version of QuantShare, you can now use quarterly as a time frame in your chart, backtests, composites and screeners.
To do this, simply select "Quarterly" in the time frame control.

In the composite tool for example, create a new composite, click on "Next" twice to move to the third screen. Click on "Daily" next to "Select a time frame" then select "Quarterly".


Median Composite Function

The composite function is one of the most powerful function in QuantShare. It allows you to calculate market indicator and rank securities very easily using a single line of code.

The following QS language formula, for example, calculates the average daily return for all securities in your database:
a = comp(perf(close, 1), "avg");

And here is how to use the new 'Median' function to calculate the median daily return for all securities in your database.
a = comp(perf(close, 1), "med");

More information about the composite function:
How to create market indicators using the composite function - Part 1
How to create market indicators using the composite function - Part 2
How to create market indicators using the composite function - Part 3
Trading Indicators using the Rank and Percentile functions
New Ranking and Percentile Composite Functions


New Data Feed for the Indian Markets

With this new release, we have added support to a new real time data provider (http://globaldatafeeds.in/) that provides streaming data for Indian markets.

In order to connect to Global datafeed, select "Accounts -> Connect" then "Global Datafeeds".
In the new form, enter your ApiKey (that is provided by Global Datafeeds) then click on "Close".

To learn more about real time features, please check the following links:
Presentation of QuantShare's new Real Time Version
Real-Time Quote Sheets with QuantShare

Note that the data feed is available only in the premium version of QuantShare.
Please send us an email if you want to upgrade from the advanced to the premium version.

Backtest Trading Strategies Programmatically and on Schedule

$
0
0
Using the QuantShare API, it is possible to perform many tasks programmatically. One of the things you can do is backtest and get results of a specific strategy. This can be accomplished using the Script Editor tool.

To open the script editor, select "Tools -> Script Editor" then create a new script using "File -> New".

To access and run backtests, you need to use the "Simulator" object. This object allows you to retrieve the list of trading systems, create trading systems, update them, backtest them and optimize them.

In the script editor, type "Simulator." (without the double quotes), after typing the dot, a list of available methods will be displayed.

Examples to help you get started

To list all your trading systems, you can for example use:

string[] ts = Simulator.GetTradingSystems("");
// Category is empty here to get all trading systems


To create a new trading system based on an existing one (copy) then update the start date:

QSTradingSystem ts = Simulator.CreateTradingSystem("", "MyStrategy");

ts.CopySettingsFromTradingSystem("", "ExistingStrategyName"); // Replace "ExistingStrategyName" with the name of an existing strategy you have

ts.StartDate = new DateTime(2000, 10, 1); // Year, Month, Day

ts.Save();


To backtest a specific strategy:

SimulatorTask task = Simulator.Backtest("", "MyStrategy", true);
// The last parameter indicates whether to show a report or not (Run the backtest silently)


Note that this function returns a "SimulatorTask" variable.
We can use this variable to check whether the simulation ended and to access the report programmatically.

The following example will run the backtest silently then display a message with the simulation annual return:

SimulatorTask task = Simulator.Backtest("", "MyStrategy", false);

while(!task.IsCompleted){
App.Main.Sleep(100);
}

// Returns one report after a backtest (we access it using [0] next to Reports variable) and multiple reports after an optimization

double annualReturn = task.Reports[0].AnnualReturn;

MessageBox.Show("The strategy annual return is: " + annualReturn);


Backtest on Schedule

You can schedule backtests to run at specific times or after an event (such as a new file added or updated in a directory) using the "Task Manager" tool of QuantShare.

First, you need to create a script to run the backtest.

- After that, open the task manager using "Tools -> Task Manager".
- In the new "Task Manager" control, click on "Click here to add a task".
- Specify the task trigger settings then click on "Add" button at the bottom/left corner to add the script to be executed when the task is triggered.
- Name your task then click on "Add" at the bottom/right corner.

The task will be added in the task scheduler of the Windows operating system and when executed will execute the script.

You can even have the script open automatically QuantShare if it is closed.
To enable this, check the "Execute even if application is not loaded" field in the "Add Task" form.

More about QuantShare Programming Language

$
0
0
QS language is a very simple programming language used in QuantShare to plot lines, create indicators, composite, trading systems, watchlists, scan stocks...

Previously, we created a blog post that introduces QS language. We strongly suggest you read that post before continuing here.
QuantShare Programming Language Tutorial

Besides the popular and less popular indicators, there are a lot of functions that can be used in QS language to plot and detect your own pattern, formula, indicators...
Many of the most basic functions were introduced in the blog post referenced in the link above.


Introducing the logical operators (And/Or)

Let us begin by one example:
a = close > 10.5 AND volume > 1000;

In the above example, the "And" operator was used (you can also use && instead). The formula assigns a value of "1" to each bar of the "a" array/vector if the close is higher than 10.5 AND the volume is higher than 1000;

b = close > 10.5 OR volume > 1000;

The above formula assigns a value of "1" to each bar of the "a" array/vector if the close is higher than 10.5 OR the volume higher than 1000.
You can use || instead of OR.

If the conditions are not met then "a" would get a value of "0" on the corresponding bar.

You can combine AND and OR operators. Make sure to use parentheses to make the code clean.

Example:
c = (close > 10.5 AND volume > 1000) OR (close > 10.5 AND volume < 1000);

Here is how the values of the a, b and c variables will look like given a sample close and volume data.


Referencing another time-series

When analyzing a particular formula, whether it is for charting, backtesting or screening, that formula is always applied for each symbol individually.

When the formula finds the variable "close", the engine will use the close price of the currently analyzed security.

The "GetSeries" function allows you to reference an external security time-series.

closeSPY = getseries("spy", close);

This will get the close series of the "SPY" ETF and associate it with the "closeSPY" variable.

Now, let us analyze the following formula:

closeSPY = getseries("spy", close);
a = close / closeSPY;
filter = sma(a, 10);


If you are running this formula using the screener tool and you are analyzing say two symbols (IWM and QQQ) then screener will run that formula on these two symbols.

The first run will calculate the ratio of the IWM close series to the SPY close series and then return the 10-bar moving average of that ratio.
The second run will calculate the ratio of the QQQ close series to the SPY close series and then return the 10-bar moving average of that ratio.

Note how the SPY series is fixed here since we explicitly referenced the ticker symbol "SPY" in the "GetSeries" function.


Indicators Crossover

Often you need to detect when a time-series or an indicator crosses above or below another time-series, indicator or an horizontal line.

This can be easily achieved using the "cross" formula. Below are three examples:

// Returns 1 for each trading bar where the close price crosses above 20. The close price must be lower than 20 in the previous bar and higher than 20 in the current bar
a = cross(close, 20);

// Returns 1 for each trading bar where the close price crosses above its 20-bar simple moving average
a = cross(close, sma(20));

// Returns 1 for each trading bar where the close price crosses below its 20-bar simple moving average (The opposite of the previous line)
// This is equivalent to 20-bar simple moving average crossing above the close price
a = cross(sma(20), close);


Tips

In the QuantShare formula editor, there is a very important shortcut that allows you to display the list of available functions depending on the cursor location (start of the line, after "=" operator, inside a function parameter...). That shortcut is CONTROL+SPACE.

When typing a function and after you type the first parenthesis (Example: a = rsi( ), QuantShare will display a tooltip that shows the number of parameters that the function accepts and a description of each parameter. You can also click on that tooltip to display other variations (if exists). This is in case the function accepts different numbers of parameters.

As an example, the "RSI" function has two variations. One that accepts two parameters:
a = rsi(close, 14); // 14-bar RSI of the close time-series

And another one that accept just one parameter:
a = rsi(14); // Same as above. In this case, the close time-series will be used by default

Profile Graphs

$
0
0
You can plot profile graphs on QuantShare by using the "PlotProfile" function. To learn more about the QuantShare programming language, please check this.

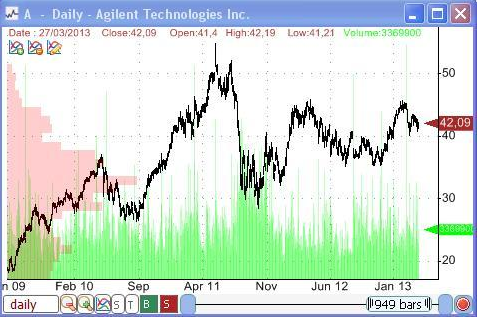
Here is how a profile graph looks like. The graph in red displays the volume by price. By looking at the chart, you can quickly see at which price range the highest volume occurred. These could be potential support and resistance areas.


And here is the function used to display that profile:
PlotProfile("volume", 0, 1, 100, colorRed, colorRed, OperationSum);

The profile function isn't designed to show only volume but can be used to display anything.

Here are some examples:
Number of instances where the asset closed higher (close > open) displayed per price range and for each trading year (new/different profile for each year)
PlotProfile("close > open", year() != ref(year(), 1), 1, 100, colorBlue, colorBlue, OperationSum);

Average RSI by price range
PlotProfile("rsi(14)", 0, 1, 100, colorBlue, colorBlue, OperationAvg);

Daily volume profile on a weekly price
PlotProfile("volume", 1, 1, 5, colorRed, colorRed, OperationSum);


The function contains several parameters.

Formula: Defines the profile formula
For a profile graph based on volume, simply type: "volume"
For a profile graph based on 25-bar simple moving average, type: "sma(25)"

New Profile Condition: Specify when to create a new profile
To display only one profile for all trading data, type: 0
To display one profile for each trading bar, type: 1
In a daily chart and in order to display one profile per week, type: week() != ref(week(), 1)

Time frame: Specify the time frame used to calculate "Formula"

Number of buckets: The number of buckets (price range) for each profile

Back Color: The back color of profiles

Font/Border Color: The font and border color of profiles

Operation: Specify the operation to perform in this profile and some styles. You can separate values using the character |

OperationAvg: calculate the average of the "Formula" values for each bucket
OperationMax: calculate the maximum of the "Formula" values for each bucket
OperationMin: calculate the minimum of the "Formula" values for each bucket
OperationRank: calculate the rank of the "Formula" values for each bucket
OperationSum: calculate the sum of the "Formula" values for each bucket
ShowBorder: Display profile borders
ShowValues: Show the value of each profile bar

UseRthOnly: Uses data from regular trading hours only (intraday)

Note:
1/ If you have an EOD chart and you want to use intraday data in your profile graph, simply use a negative value as "Time frame". Same for Intraday charts.
2/ For EOD data, time frame is expressed in days
3/ For Intraday data, time frame is expressed in seconds

In a future article, we will show you how to access profile data using C# and create advanced custom functions based on the profile data.

Create Graphs using the Grid Tool

$
0
0
The Grid tool is one of the tools that are available with the Premium version. The reason for that is that the Premium version supports real-time data and the grid tool was mainly created to display and work with real-time data using one or several data feeds.

Let us show you today how to create graphs using the grid tool.

Select "Tools -> Grid" then "Grid Editor"
Select "File -> New" in the Grid editor then type in the number of rows and columns. Example: 30 as the number of rows, 10 as the number of columns


Add Formulas

Type "GOOGL" in A1 cell
Click on A2 cell then click on the "Fx" button at the top under the tool bar.

Let us select a function now. We want to display the real time data of GOOGL, so we select "Intraday" then "GetClose".
Type A1 as "Symbol Name". QuantShare will get the symbol name from the "A1" cell. Changing the value of "A1" will automatically update any function that references that cell.
Set 60 as "Time Frame". This will display the last price of the last 60 second -1min- bar. Same as the last tick which has a time frame of 0.

If you do not see any data then make sure that you are connected to a data provider such as "IEX Exchange", "Interactive Brokers", "Yahoo Feed"...
Also, you need to make sure that your cells are using the correct data provider. For this, select all cells then right click, select "DataFeed" then select the data provider you want to work with.

Click on A3 cell then enter the following formula directly next to the "Fx" button at the top. Note that you can use the formula editor but we want to show you here how to quickly add a formula to a particular cell.
=GetOpen(A1, 60)

// This will display the open price of the last 1min bar
Note that by default there is no backfill so you will need to wait here 1min in order to get the correct open price.

Click on A4 cell then enter the following formula:
=Round(A2-A3, 3)

// This will display the difference between the close and open value of the last 1min bar


Copy Cells

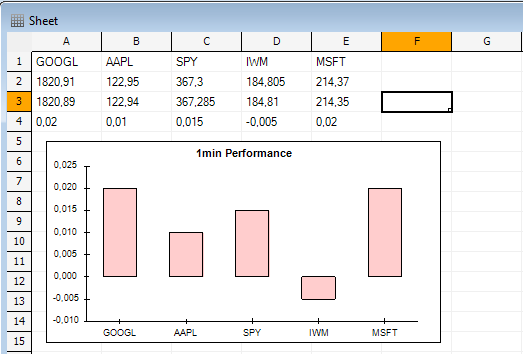
Select the first four cells (A1, A2, A3 and A4) then click on the right/bottom corner and move your mouse to the right to copy the cell, just like you would do with Excel.

In the first row, update the "GOOGL" text and type in other stock or ETF ticker symbols.


Create Chart

Select "Insert -> Chart" then select "Vertical bar" as type of chart
Right click on the chart, select "Chart Settings" then update the chart's title. Example: "1min Performance"

Right click on the chart, click on "Select Cells", select the cells in the fourth row (Example: A4:E4) then click "OK" on the new "Select Cells" control.
Right click on the chart, click on "Select X-Axis Cells", select the cells in the first row (Example: A1:E1) then click "OK" on the new "Select Cells" control.

Your chart is ready now. You can move it, edit it and watch it update in real time.


Chart Layouts Explained - With Custom Scripts

$
0
0
Chart layouts contain information such as the number of panes, the formula(s) as well as the template that is applied by each pane.


How to create a layout?

To create a layout from a chart, right click on that chart, then select "Save layout as...". Type the name for your layout then save.


How to apply a layout?

To update a chart layout, right click on a chart, select "Change Layout" then select the layout you want to apply.
You can also apply a layout to all opened charts by clicking on the button as shown in the picture below then selecting the appropriate layout.


You can also switch from one layout to another using the CONTROL+ALT+L hotkey


Custom Scripts?

The previous hotkey we introduced allows you to move from one layout to the next one. But how to access the previous layout instead of the next one?

There is no hotkey for this so we are going to create our own hotkey to do that.
You can create a custom script and assigns a shortcut to it with the "Add Shortcut" feature that you can find after selecting "Divers -> List of shortcuts" at the bottom of Alchemcharts.

The script should be created using "Tools -> Script Editor".

Here is an example:

if(!Global.ContainsVariable("layout_index"))
{
Global.SetVariable("layout_index", 0);
}
int index = (int)Global.GetVariable("layout_index");
string[] layouts = App.Main.GetLayoutNames();
App.Main.UpdateChartLayout(Charts.GetSelectedChartId(), layouts[index]);
index = index - 1;
if(index < 0)
{
index = layouts.Length - 1;
}
Global.SetVariable("layout_index", index);


The idea here is to check the value of the global variable "layout_index" (that we define).
Then, we get the list of all layouts, pick the layout given the "layout_index" then subtract one to "layout_index", so that the next time the script is called we will get the previous layout.

After you create the script, select "File -> Save As..." then save it under the "Scripts" folder.
Now, at the bottom of QuantShare, click on the "Divers" icon then "List of Shortcuts".
In the new form, click on "Add Shortcut".


Type the name of the shortcut, a description, how to activate it then finally enter the script path.
If you named the script "prev_layout" then you should enter there: Scripts\prev_layout.azf


Automation Ideas?

There are several ways we can use the layout tool. And when combined with custom scripts capabilities, we can further create advanced and creative stuff.

Below are some examples of what you can achieve:

Update Chart Layout based on Active Time Frame:
In this post, we show you how to change the layout of a chart dynamically based on the current chart time frame.

Update Chart Layout based on Active Ticker Symbol:
In this post, we show you how to change the layout of a chart dynamically based on the current chart symbol.
For example, you can display the RSI on the lower pane for stocks and when switching to an index display a market breadth indicator.

Update Chart Layout based on Active Ticker Symbol - Part 2:
This is the second part of the previous blog post. Here, we explain how to associate a specific layout to a list of symbols so that a specific layout is applied to a chart each time a symbol in a specific list is selected.

Viewing all 106 articles
Browse latest View live